
Contents (6)

·
Robinhood Chain's First 100 Days: Transactions Down 44%, Stablecoins Up 4.6x
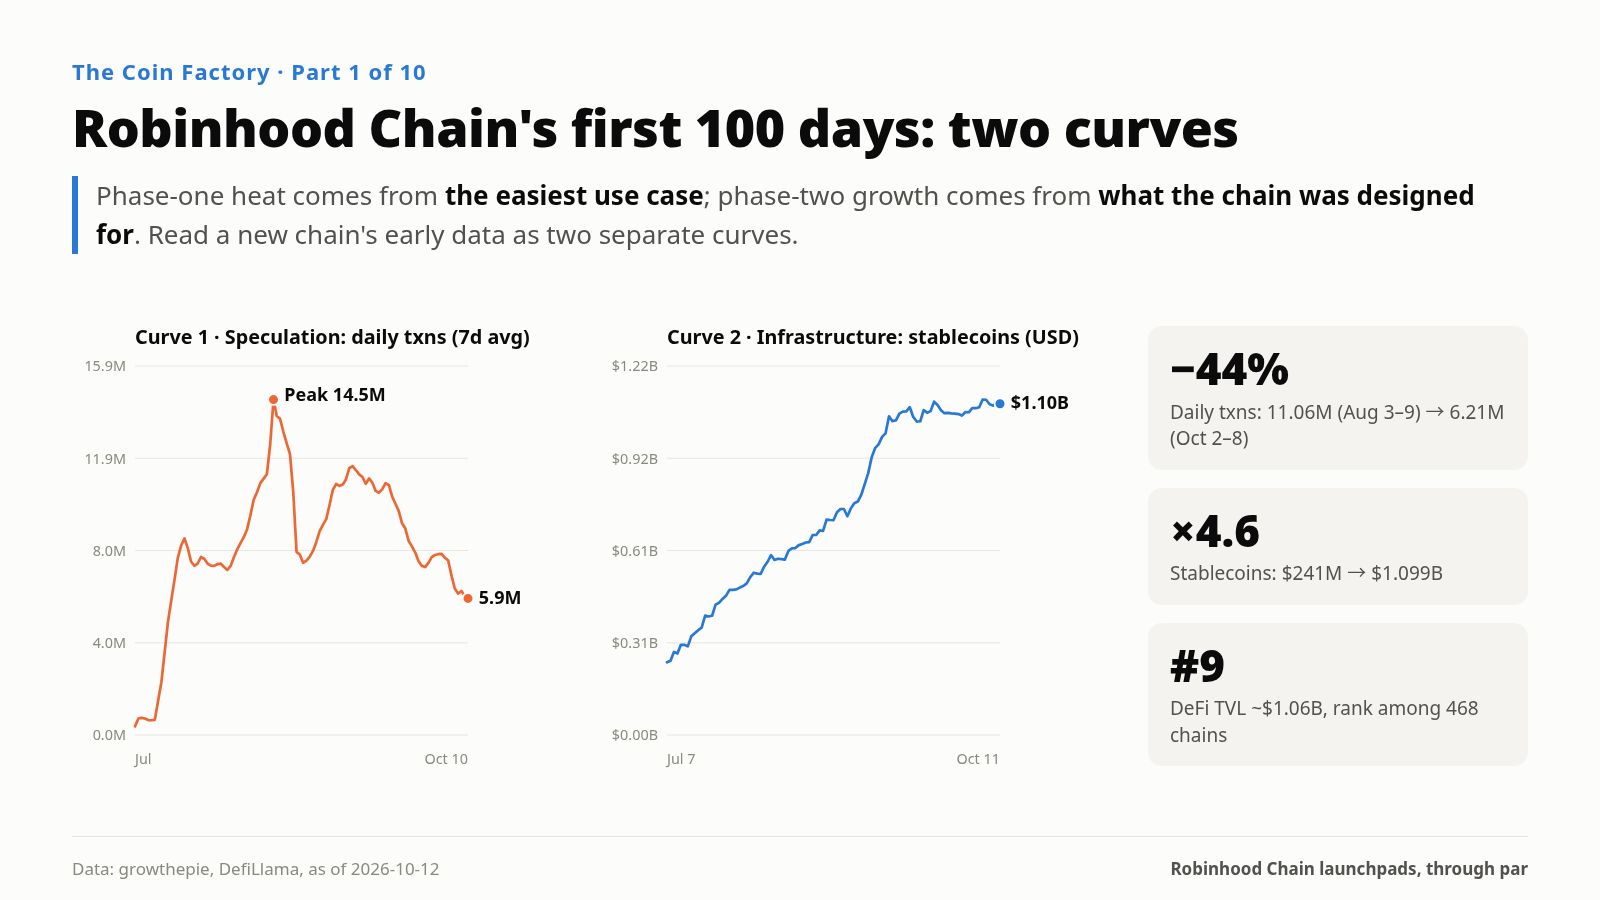
Robinhood Chain at 100 days: daily transactions fell from ~11.06M in early August to 6.21M in early October, while stablecoins grew ~4.6x and TVL ranks ninth. Split early data into a speculation curve and an infrastructure curve, plus four rules for reading a new chain.
If you’re evaluating projects on a new chain, or you have to explain to your team or LPs whether a chain is actually “hot,” start with two sets of numbers. Same chain, same period.
Set one: according to growthepie, Robinhood Chain averaged about 11.06 million transactions a day in the week of August 3–9. In the week of October 2–8 it averaged about 6.21 million, down 44%. Daily fees at Pons, the chain’s largest launchpad, hit $11.42 million on September 5. By October 11 they were $340,000, down 97% (DefiLlama).
Set two: over the same stretch, stablecoins on the chain grew from $241 million on July 7 to $1.099 billion on October 11, roughly 4.6x. DeFi TVL is about $1.06 billion, ninth among the 468 chains DefiLlama tracks.
Look only at the first set and the chain is dead. Look only at the second and it’s taking off. Neither conclusion is right. Or rather, each is half right.
A broker built a chain, and memes showed up first
Robinhood announced mainnet on July 1: an Ethereum L2 on the Arbitrum stack, ~100 ms blocks, gas paid in ETH. The official pitch was “AI-native, purpose-built for real-world assets.” The launch event was about stock tokens, on-chain lending and AI agent trading. Day-one partners included Uniswap, Chainlink, Alchemy and BitGo.
What scaled first, though, were token launchpads: tools that let anyone create a token and start trading it in under a minute. Galaxy, citing CoinGecko, reported that memecoins made up 79.2% of on-chain DEX volume as of July 27. By September the chain had more than 30 launchpads.
Plenty of people read this as an “RWA chain” going off the rails. It’s actually the normal path for a new chain. A chain needs its first users, its first liquidity and its first developers, and launching and trading tokens has the lowest barrier of anything. Solana had pump.fun; Base went through its own launchpad wave. Robinhood didn’t pretend otherwise. CEO Vlad Tenev said publicly the chain is “great for memes.” Two weeks after launch, Robinhood Crypto GM Johann Kerbrat went on the Unchained podcast, and the episode description put it this way: memes are the bulk, RWAs are a sliver, and that mix was always part of the plan.
Two curves
Split the first hundred days of data by what it measures and you get two curves moving in different directions.
Curve one: speculation. Transaction counts, tokens launched, launchpad fees. It has two peaks. The first came in mid-August, when daily transactions hit 19.63 million on August 11 and 26.05 million on August 12. The second came in early September: Pons fees peaked on September 5, and daily transactions climbed back to 12.7 million on September 10. Since then it has slid, with another leg down around the September 29 expiry of the gas subsidy.
Curve two: capital and infrastructure. Stablecoins, TVL, RWA holders, integrations by major protocols. No obvious peak here; it just keeps rising. About six weeks after launch, the chain had more than 420,000 RWA holders (CryptoBriefing, August 10). By Token Terminal’s count on September 25, about 1.3 million people held tokenized stocks on the chain, second only to BNB Chain’s 1.8 million and ahead of Solana’s 997,000. In the same Galaxy data, RWAs’ share of DEX volume rose from 0.39% in week one to 8.58% in the week of July 21–27.
One curve is falling, the other is rising. Together they describe a chain moving from its easiest use case toward the thing it was built to do.
So the first principle: phase-one heat comes from the easiest use case; phase-two growth comes from what the chain was designed for. Read the two curves separately.
The gas subsidy amplified curve one
At mainnet launch, Robinhood started a 90-day gas subsidy. It only covered swaps initiated from Robinhood Wallet; third-party wallets paid gas normally the whole time.
That’s narrow coverage, but it was enough to change a launchpad’s unit economics: users could launch and wash-trade at near-zero cost while the platform took a cut of every trade. The result was some extreme numbers. par, the case study in this book, launched 1,327 tokens on September 26 (UTC) alone, nearly 40% of everything it had launched in its first 38 days (par’s official indexer).
Those numbers fell back after the subsidy ended. That’s the amplifier switching off, not demand disappearing. On DefiLlama’s chart, Pons fees were already down to $2.03 million by September 20, more than 80% below the peak, and stood at $1.63 million when the subsidy ended on September 29. The expiry just confirmed a change already under way.
Subsidy-era data tells you how many people a chain can get to try it. It doesn’t tell you how many will stay. For that you need the first full quarter after the subsidy.
When par walked in
This book uses par.family as its case study. It went live on September 4, and its platform token launched the same day (block 54,535,851).
Put that on the timeline: the day after par launched, Pons fees hit the high point of the whole first phase. Twenty-five days later, the gas subsidy expired. When par arrived there were already about 30 launchpads on the chain, and it landed almost exactly on the crest of phase one. Even so, in its first 38 days it launched 3,460 tokens and did about 22,000 ETH in cumulative volume (par’s official indexer).
That shapes how to read its first month. Those numbers record a crest and an ebb. They don’t represent its potential in the next phase, just as Pons’s $11.42 million on September 5 isn’t normal for Pons either. The first month is good for understanding a launchpad’s fee structure and money flows. Whether it can carry the next phase depends on its technology and product.
Four rules for reading a new chain’s early data
1. Separate the speculation curve from the infrastructure curve. Transactions, tokens launched and launchpad fees go in the first; TVL, stablecoins, RWA holders and major-protocol integrations go in the second. The two often move in opposite directions. Add them into a single “heat” number and you lose the signal.
2. Discount the data by the subsidy’s scope and duration. Ask who the subsidy covers and when it ends before you look at activity. Calibrate subsidy-era highs against the first quarter after.
3. Watch where the chain operator puts its own resources. At HOOD Summit on September 29, Robinhood announced more than 15 new products, including Robinhood Agents and plans for 24/7 stock trading, and its in-app trading community, Robinhood Social, came out of beta. Where the operator keeps investing is usually where phase-two growth comes from.
4. Judge early apps by capability, not volume. The app with the most volume in phase one isn’t necessarily the best fit for phase two. If this chain heads toward stock tokens and AI-agent trading, launchpads will compete on whether they can pair with stock tokens, whether agents can call them programmatically, and whether wallets and terminals can plug them in, not on how many tokens got minted during the subsidy. Later pieces in this series dig into each.
Closing
A new chain’s first hundred days tell you how many people it can get to try it.
What it was designed to do decides how many stay.
The falling curve is the loudest. The rising one is what tells you the chain itself is growing.
When you look at a new chain, which number do you check first: transactions, TVL or stablecoins? Tell me why in the comments.
— Excerpted from Chapter 1 of The Coin Factory, “A Chain’s First Hundred Days”
Repost this post?
Share with your followers.
Reply