
Contents (5)

·
Self-Consumption Ratio: par's External Volume Rose ~80% in a Day. Which Ruler Values Its Token?
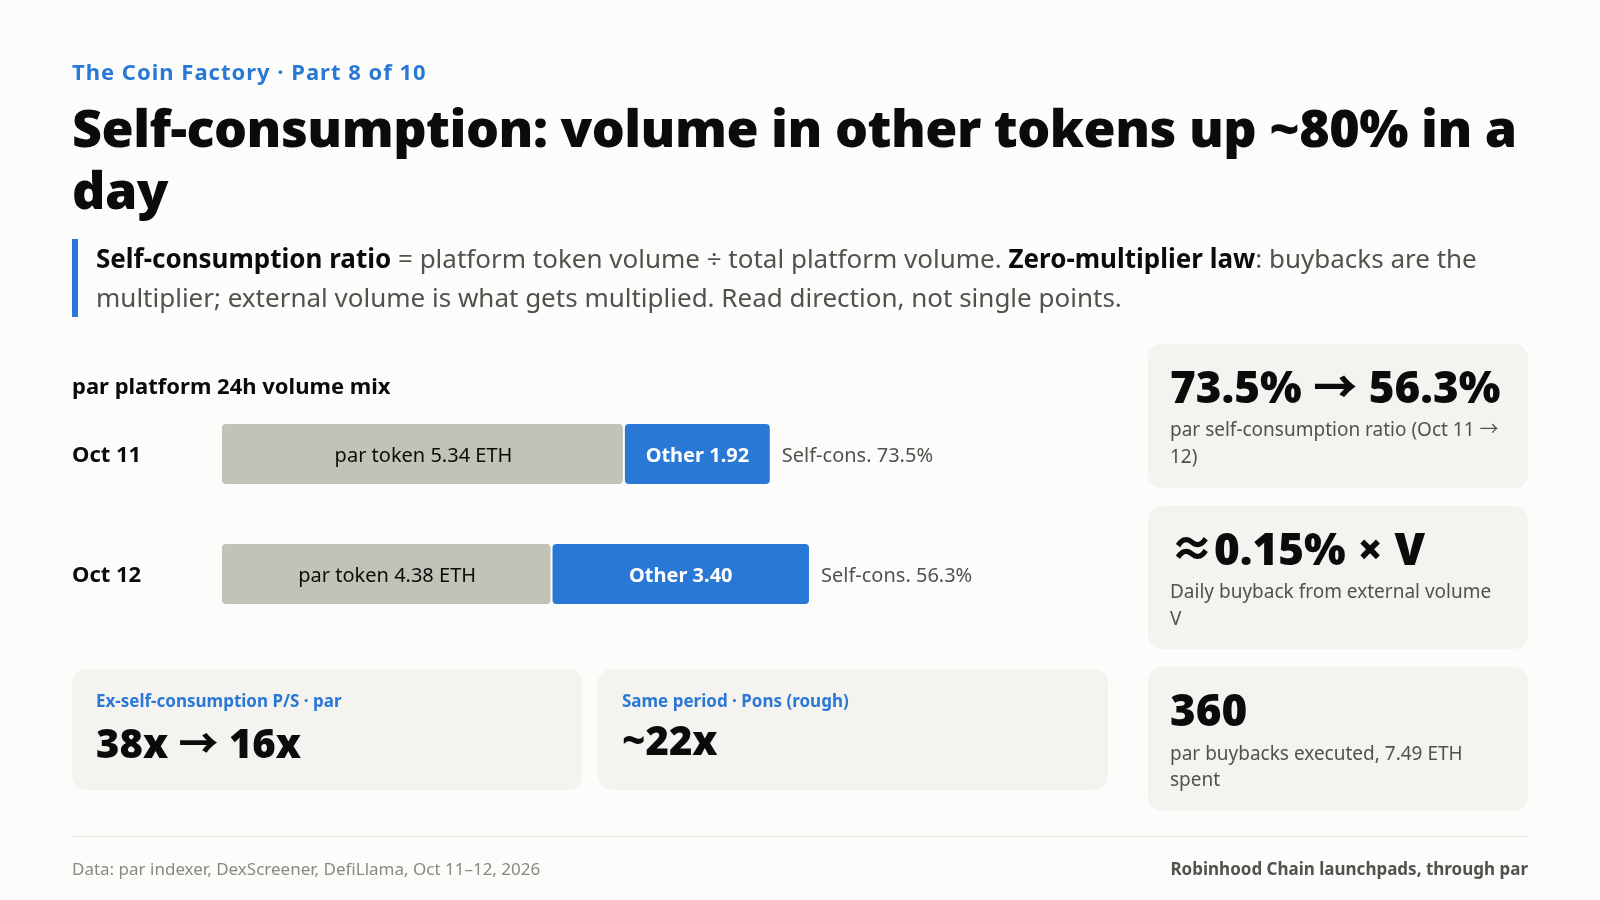
Two metrics for valuing a launchpad token: the self-consumption ratio (platform token volume ÷ total platform volume) and the zero-multiplier law for buybacks. Worked on par and Pons: par's external volume rose ~80% in a day and its ex-self-consumption P/S fell from ~38x to ~16x.
If you’re valuing a launchpad’s platform token, or trying to judge whether a platform’s revenue reflects real demand, this piece gives you two metrics you can calculate directly, worked through on par and Pons on Robinhood Chain.
Start with par’s readings on two consecutive days (par’s official indexer, 24-hour window):
| October 11 | October 12 | |
|---|---|---|
| Total platform volume | 7.26 ETH | 7.78 ETH |
| Of which, the platform token itself | 5.34 ETH (73.5%) | 4.38 ETH (56.3%) |
| Other tokens on the platform | 1.92 ETH | 3.40 ETH |
In one day, volume in the platform’s other tokens went from about 1.9 ETH to about 3.4 ETH, up roughly 80%, and the platform token’s own share fell from 73.5% to 56.3%.
That shift deserves more attention than any price-to-sales ratio, because it measures the thing that matters most for a launchpad: whether more and more people are using it to launch and trade tokens. Which brings us to the first framework.
Framework one: the self-consumption ratio
Self-consumption ratio = the platform token’s own volume ÷ total platform volume
It answers: is the platform being used by others, or is it trading itself?
A launchpad’s ideal flywheel: users come to launch tokens, other people trade those tokens, the platform collects fees, and then buys back its platform token. The platform token’s value comes from volume in the other tokens on the platform.
If most of the platform’s volume is the platform token itself, the flywheel runs backward: speculators trade the platform token, the platform collects fees from those trades, then uses that money to buy back the platform token. It’s a self-referential loop. It reinforces itself on the way up but creates no outside value, and when the heat fades, revenue and price fall together.
A rule of thumb (this book’s judgment, not an industry standard): below 20%, the platform is mainly used by outsiders; 20%–50%, the platform token is still the main traffic driver and you should watch the trend in external volume; above 50%, the flywheel is still starting up. Almost every new launchpad starts in the third bracket, since the platform token is the first and most-watched asset. What matters is which way the ratio is moving.
Two days of readings
| par 10-11 | par 10-12 | Pons 10-10 | Pons 10-11 | |
|---|---|---|---|---|
| Self-consumption ratio (24h) | 73.5% | 56.3% | ~26% | ~36% |
| Plain P/S | ~5.8x | ~4.6x | ~11x | ~14x |
| Ex-self-consumption P/S | ~38x | ~16x | ~15x | ~22x |
(par: 24-hour per-token volume from the official indexer, with protocol revenue derived from the 1% fee and split rules; the 10-12 reading was taken at 02:15 UTC that day, with 24-hour platform volume of 7.78 ETH, 4.38 ETH of it in the platform token, market cap about $259,000, ETH at about $2,536. Pons: daily revenue from DefiLlama, platform volume backed out from daily fees at 1%, PONS’s own volume summed across 30 pools on DexScreener. The methods aren’t fully aligned, so treat these as rough estimates.)
Ex-self-consumption P/S is: market cap ÷ (annualized protocol revenue × share of revenue from external tokens), where external revenue is protocol revenue excluding the platform token’s own pool.
The table shows two things. First, plain P/S counts the platform trading itself as revenue, so for valuing a launchpad token, the ex-self-consumption measure is more honest. Second, on that measure, par’s reading is highly sensitive to external volume: external volume rose about 80% in a day, and ex-self-consumption P/S dropped from about 38x to about 16x, below Pons’s ~22x over the same period. Early platforms swing a lot, and one day’s reading shouldn’t drive a valuation call. But it shows where par’s valuation leverage is: every bit of extra volume in other tokens on the platform adds directly to the platform token’s “real revenue.”
Framework two: the zero-multiplier law
Almost every launchpad platform token talks about buyback-and-burn. But buybacks don’t create value on their own; they just turn platform revenue into buy pressure on the platform token.
Take par. Buybacks driven by external volume:
Daily buyback = external volume V × 1% fee × 50% protocol share × ~50% quote-asset share × 60% buyback ratio ≈ 0.15% × V
The “~50% quote-asset share” is because buy-side fees are paid in quote assets like ETH and USDG, which can fund buybacks, while sell-side fees are paid in the token being traded, which by rule gets burned directly and has nothing to do with the platform token. (The par token has another channel: fees in its own pool denominated in the platform token are burned directly. That accounts for nearly 90% of cumulative burns and is unrelated to external volume, as covered in the previous piece.)
| External daily volume V | Annualized buybacks | As share of current market cap (~$260K) |
|---|---|---|
| $5,000 | ~$2,700 | ~1% |
| $50,000 | ~$27,000 | ~11% |
| $500,000 | ~$270,000 | ~1x |
| $5,000,000 | ~$2.74M | ~10x |
The actual numbers: in the 7 days before October 12, par’s buyback wallet executed 14 times, spending about 0.049 ETH, roughly $124. Cumulatively it has executed 360 times and spent 7.49 ETH. The mechanism keeps running by its rules; the size of the buy pressure depends on external volume V. The table also shows the leverage: take V from $5,000 to $50,000 and annualized buybacks go from about 1% of market cap to about 11%.
Buybacks are a multiplier, not an addend. However cleverly you design the multiplier, anything times zero is still zero.
Two implications.
When evaluating buybacks, look at V first, then the ratio. A high buyback ratio means nothing until it’s multiplied by external volume; conversely, once external volume picks up, a buyback mechanism already in place amplifies it immediately.
Buyback transmission weakens noticeably in a downturn, because V falls fastest then. Pons is the same: DefiLlama shows about $9.85 million in revenue over the last 30 days and about $570,000 over the last 7. Annualized from 7 days, that’s about $29.7 million; from 30 days, about $120 million. The same buyback mechanism transmits buy pressure that differs by about 4x depending on the window.
Four steps to value a platform token
- Calculate the self-consumption ratio before looking at any revenue metric. Data comes from per-token volume in the platform’s indexer or Dune, plus volume across all the platform token’s pools on DexScreener.
- Use ex-self-consumption P/S instead of plain P/S. Only protocol revenue from external tokens is revenue the platform earns as a tool.
- Annualize from the last 7 days, not 30. Launchpad revenue decays fast, and a 30-day window systematically overstates it.
- Check buybacks against both the rules and the actual execution record.
Closing
A launchpad platform token’s value doesn’t depend on how much the token itself gets traded.
It depends on how much the other tokens on the platform get traded.
The self-consumption ratio tells you how much of the platform’s volume comes from others. The zero-multiplier law tells you how much of that can become buybacks.
When you value a platform token, do you strip out its own volume?
— Excerpted from Chapter 9 of The Coin Factory, “Self-Consumption and the Zero Multiplier”
Repost this post?
Share with your followers.
Reply