
Contents (6)

·
Pump.fun: Platform Evolution and PUMP Price Performance
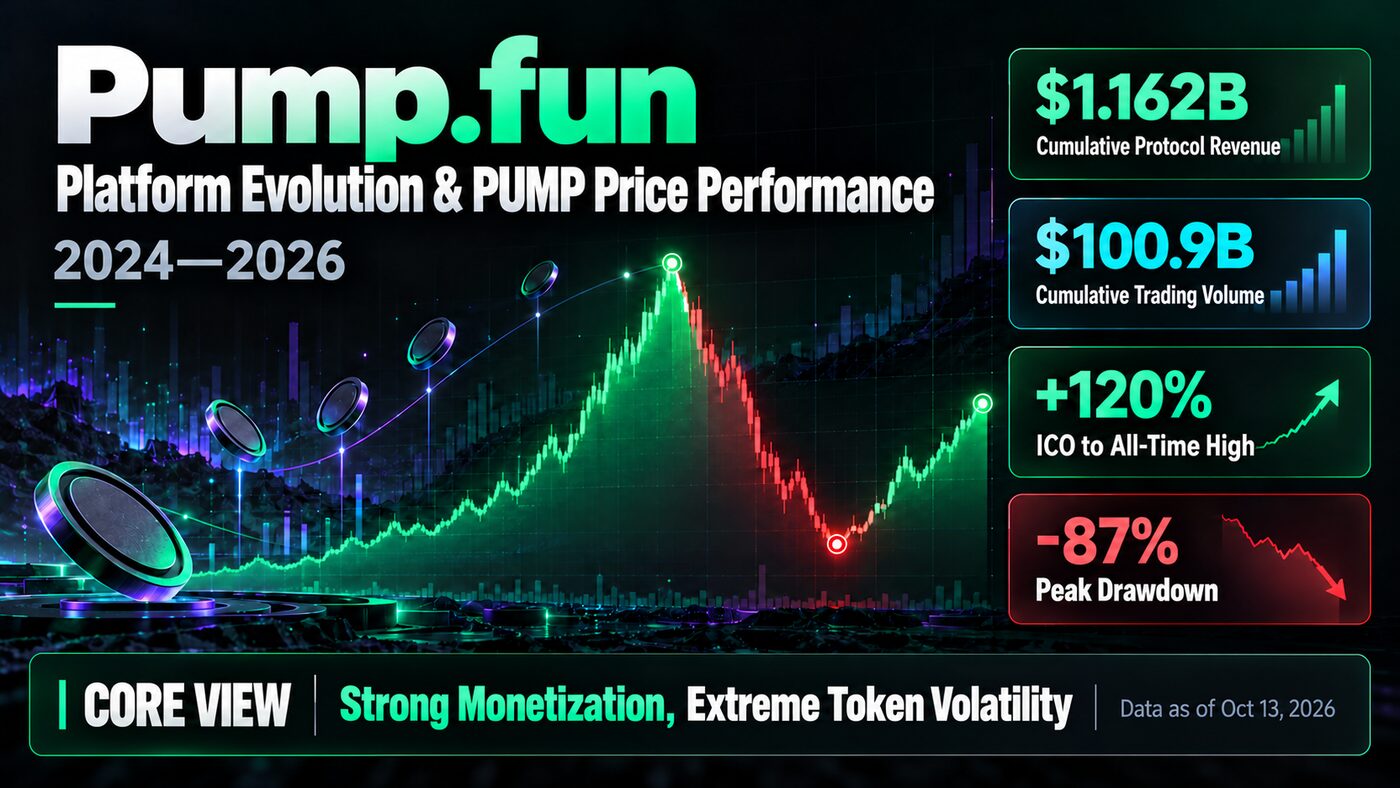
A data-driven review of Pump.fun from 2024 to 2026: platform evolution, protocol revenue, trading volume, PUMP's ICO-to-peak performance, maximum drawdown, valuation and the risks behind its buyback narrative.
Scope: Pump.fun and its native token, PUMP
Data snapshot: October 13, 2026
Note: Crypto prices change continuously. This report is a point-in-time research snapshot, not investment advice.
1. How Pump.fun Evolved
| Date | Milestone | Why It Mattered |
|---|---|---|
| January 2024 | Pump.fun launched on Solana | It reduced token creation to a one-click process with automated bonding-curve pricing and no requirement for the creator to seed liquidity upfront. |
| H1 2024 | Memecoin issuance accelerated | By June 2024, the platform had generated roughly $43 million in cumulative revenue. More than one million tokens had been created by July. |
| May 2024 | Private-key security incident | Approximately $1.9 million was affected in the platform’s principal recorded security incident. |
| Mid-to-late 2024 | Livestreaming, comments and social features were introduced | Pump.fun began moving beyond a launchpad toward a market built around trading, content and attention. |
| November 2024 | Livestreaming was suspended following extreme content | The episode exposed material risks around moderation, minors and market manipulation. Pump.fun later introduced a formal livestream moderation policy. |
| December 2024 | UK access was restricted following an FCA warning | Regulatory risk began to affect the platform’s geographic reach directly. |
| Early 2025 | Revenue reached a cyclical peak | Activity cooled after the memecoin boom, while competitors such as LetsBONK began challenging Pump.fun’s market share. |
| March 2025 | PumpSwap launched | Graduated tokens no longer had to rely primarily on Raydium. Pump.fun now controlled more of the stack, from issuance and price discovery to post-graduation trading. |
| May 2025 | Creator revenue sharing began | The model sought to reward creators for sustained trading activity rather than leaving token sales as their main exit path. |
| July 2025 | PUMP token sale | PUMP was sold publicly at $0.004. The approximately $600 million public sale sold out in about 12 minutes, implying a $4 billion fully diluted valuation. |
| After July 2025 | Protocol revenue began funding PUMP buybacks | PUMP developed a value-capture narrative tied to protocol revenue, although token holders did not receive a legal claim on that revenue. |
| March 2026 | Cumulative protocol revenue passed $1 billion | Pump.fun became one of the first Solana applications to cross that threshold. |
| 2026 | Expansion into trading terminals, cross-chain trading, mobile applications and ecosystem investment | Pump.fun continued evolving from a memecoin launchpad into an integrated issuance, DEX, social-streaming and trading platform. |
Pump.fun’s core achievement was not any individual memecoin. It industrialized the production of long-tail tokens:
- Every token starts trading on a constant-product bonding curve.
- Once it meets the graduation conditions, it moves into deeper PumpSwap liquidity.
- The platform earns fees from trading, graduation and related products.
- Creator incentives, livestreaming and token buybacks recycle attention back into the platform.
2. Operating Performance
At the time of this snapshot, DefiLlama reported:
- Cumulative fees: approximately $1.278 billion
- Cumulative protocol revenue: approximately $1.162 billion
- 30-day protocol revenue: approximately $42.56 million
- 30-day trading volume: approximately $4.055 billion
- Cumulative trading volume: approximately $100.9 billion
- 30-day buyback-and-burn value-capture metric: approximately $29.48 million
One statistic puts the scale into perspective. Of roughly 14 million tokens launched on the platform, only about 150,000 reached a stage with meaningful secondary-market liquidity—a graduation rate of approximately 1.07%.
That does not mean 1.07% of traders were profitable. Graduation and investor returns are different measurements. It does show that the overwhelming majority of launched tokens never reached deeper liquidity.
3. PUMP Price Performance
| Metric | Value |
|---|---|
| ICO price | $0.004 |
| Price at snapshot | Approximately $0.00508 |
| All-time high | $0.008819 on September 14, 2025 |
| All-time low | $0.001155 on June 25, 2026 |
| Circulating market capitalization | Approximately $2.35 billion |
| Fully diluted valuation | Approximately $4.2 billion |
| Circulating supply | Third-party estimate: approximately 463.5 billion; official figure: approximately 399.5 billion |
| Maximum supply | 1 trillion PUMP |
Those figures imply:
- ICO to snapshot: approximately +27%
- ICO to all-time high: approximately +120%
- ICO to all-time low: approximately -71%
- All-time high to snapshot: approximately -42%
- All-time low to snapshot: approximately +339%
Phase 1: Launch Speculation — July 2025
PUMP quickly rose from its $0.004 sale price to more than $0.006, then surrendered most of the gain within a week. The market was balancing a high initial valuation and concentrated early supply against growing competition among memecoin launchpads.
Phase 2: Buyback-Led Rally — August to September 2025
Revenue-funded buybacks became the token’s dominant narrative. PUMP reached approximately $0.008819 on September 14, 2025—more than double its ICO price.
Phase 3: Valuation Compression — Late 2025 to Mid-2026
Lower memecoin activity, token unlocks and weaker risk appetite pushed PUMP down to approximately $0.001155 in June 2026. That represented a maximum drawdown of roughly 87% from the all-time high.
Phase 4: Operating Recovery and Buyback Rebound — H2 2026
As protocol volume, revenue and token burns recovered, PUMP rose approximately 3.4 times from its low. It nevertheless remained below its historical peak.
4. Valuation
A simple annualization of the snapshot data gives:
- 30-day protocol revenue: approximately $42.56 million
- Simple annualized revenue run rate: approximately $510 million
- Circulating market cap / annualized revenue: approximately 4.6x
- FDV / annualized revenue: approximately 8.3x
These multiples annualize a single 30-day period. They are highly sensitive to current trading activity and should not be treated like normalized earnings multiples.
Three additional discounts matter:
- Third-party platforms estimate that approximately 46% of maximum supply is circulating, while Pump.fun’s official figure is closer to 40%. Data providers treat circulating and burned supply differently, so unlocks and dilution require continued monitoring.
- Pump.fun explicitly states that PUMP does not represent ownership of protocol revenue or a legal right to distributions. A buyback mechanism is not equivalent to an enforceable equity buyback commitment.
- Revenue depends heavily on memecoin trading activity and is therefore far more cyclical than revenue at a conventional exchange.
5. Conclusion
Pump.fun has been a successful platform business. It standardized memecoin issuance, then expanded from a launch tool into a DEX, social-streaming platform and trading terminal. Its revenue and trading volume demonstrate genuine demand for the product.
PUMP, however, has behaved like a highly volatile platform token. It more than doubled from its ICO price and later suffered an approximately 87% peak-to-trough drawdown. Its snapshot price remained slightly above the ICO price, but that fact alone cannot establish how much value the market assigns to the revenue-funded buyback mechanism.
The most important indicators to monitor are monthly protocol revenue, the share of revenue allocated to buybacks, net PUMP burns, token unlocks, PumpSwap market share and the graduation rate of newly launched tokens.
The short version: the platform monetizes well; the token remains extremely volatile.
Sources
- Pump.fun: Official PUMP Token Page
- Pump.fun: The Bonding Curve
- Pump.fun: Livestream Moderation Policy
- DefiLlama: Pump.fun Protocol Data
- DefiLlama: PUMP Token Data
- DefiLlama: State of DeFi 2025
- CoinGecko: PUMP Price and Market Data
- KuCoin: PUMP Token Sale
- Axios: Meme Coins Are Having a Moment
- The Block: PUMP’s First Week of Trading
- The Block: Pump.fun Surpasses $1 Billion in Cumulative Revenue
Repost this post?
Share with your followers.
Reply