
Contents (6)

·
Same Tesla stock, four onchain prices at once. Which one do you read?

On Sunday, Nov 15, Tesla tokens from four issuers showed four onchain prices at the same moment; the one closest to Friday's close came from a pool that hadn't traded in 19.5 hours. Hourly logs over the weekend and the Monday open, the multiplier, the mint/redeem door, pool fees and data sources, plus a checklist for reading a stock token price.
If you run a broker, an exchange or a wallet, or you are thinking about letting a DeFi protocol accept stock tokens as collateral, start with these numbers.
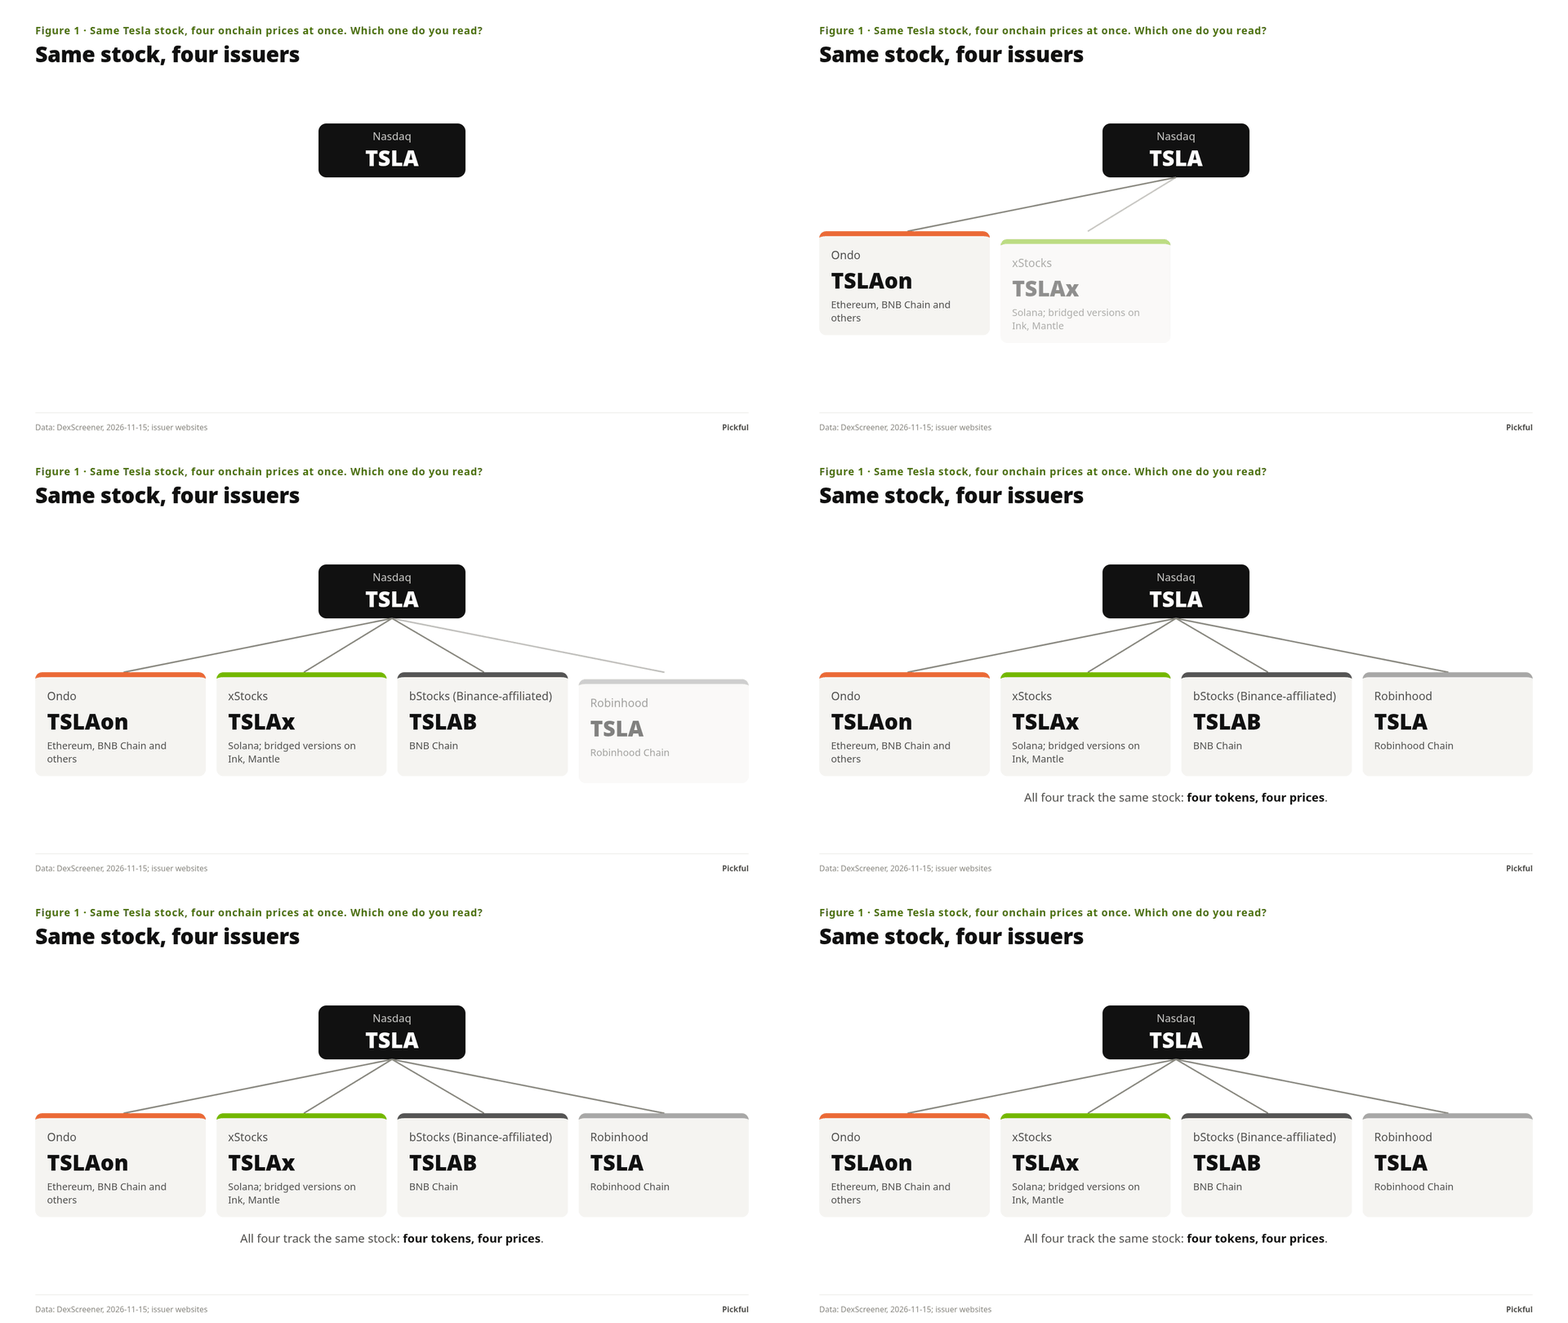
November 15 was a Sunday, and the US stock market was closed. At 21:48 UTC that day, I checked the onchain prices of Tesla tokens from four issuers:
- TSLAon, issued by Ondo (Ethereum): $390.47
-
TSLAx, issued by xStocks (Solana): $389.03
- TSLAB, issued by a Binance affiliate (BNB Chain): $388.76
- Robinhood’s own TSLA (Robinhood Chain): $388.12
Tesla closed Friday at $390.22. All four tokens sit on the same stock, yet at the same moment they showed four prices. The highest and the lowest were $2.35 apart, about 0.6%.
0.6% does not sound like much. For a lending protocol with a 1% liquidation threshold, or a market maker moving inventory between venues every day, it is the whole profit or the whole risk.
The bigger problem: of the four numbers, the one closest to Friday’s close was a price that had not traded for 19 and a half hours. Over the next day and a half I recorded these four tokens every hour, and every 10 minutes around the open. The conclusion: reading the price wrong is more dangerous than the gap itself. Last trade prices freeze, pool fees push quotes away from the stock, and data sources quietly drop pools. The rest is in five steps: first correct for the multiplier, then look at the mint/redeem door, then the measurements over the weekend and at Monday’s open, then the pools, and finally a checklist for reading a price.
1. Divide by the multiplier before you compare
One step before any comparison cannot be skipped. One stock token does not necessarily equal exactly 1 share.
When a stock pays a dividend, some issuers do not pay cash; they fold the dividend into the number of shares each token represents. Over time, one token might represent 1.02 shares. If the token then trades 2% above the stock, that is not a premium. The token simply represents an extra 0.02 shares. This ratio is called the multiplier.
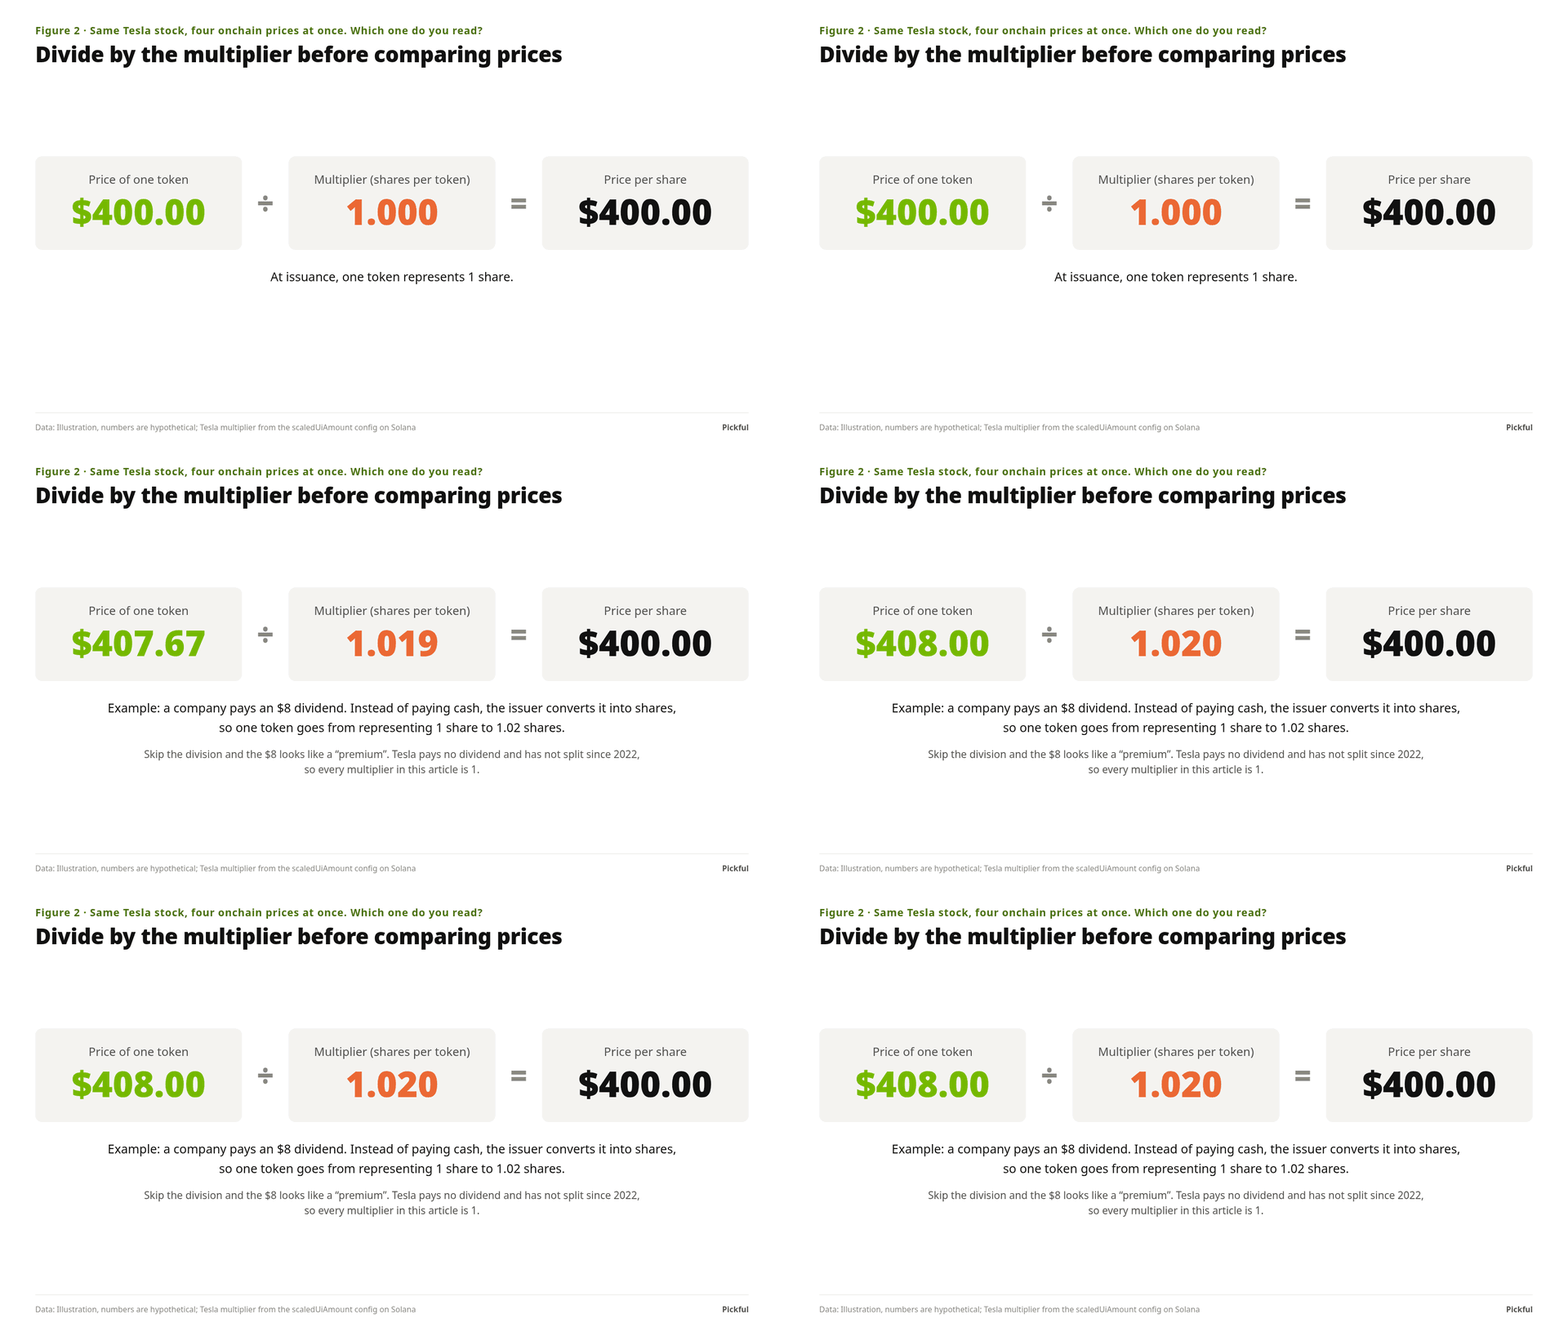
I picked Tesla because it is clean: it pays no dividend and has not split since August 2022, so every issuer’s multiplier is 1. xStocks writes the multiplier into the token’s configuration on Solana, and reading it onchain gives 1. With dividend payers such as Apple or Microsoft, if you skip the multiplier correction, part of the “gap” you calculate is fake.
2. The mint/redeem door: open, but with a 2% fee in front of it
What keeps a stock token’s price tied to the stock? Arbitrage. When the token is more expensive than the stock, an eligible institution mints new tokens with the issuer (it pays dollars or stablecoins, the issuer buys and holds the stock, then mints the tokens) and sells them onchain. When the token is cheaper, it does the reverse: buys tokens and redeems them with the issuer. Each round trip moves the gap back toward zero.
The catch is that this door is not open to everyone, or at all times.
Who can go through the door. All four require identity verification (KYC), and none are open to US persons. Ondo is open to verified institutions and individuals in supported regions, with a $1 minimum. xStocks lets individuals mint and redeem directly, with a $5,000 minimum. bStocks minting is open only to eligible subscribers in Abu Dhabi Global Market (ADGM). Robinhood’s door is open only to authorized participants, and at launch there was one: Bitstamp Global Ltd. Anyone outside the door can only trade with other people on the secondary market; they can see the gap but cannot arbitrage it.
When the door is open. xStocks minting and redemption follow US market hours, 5 days a week. Robinhood’s tokenization window runs from Monday 02:00 to Saturday 02:00 CET. bStocks officially offers conversion between the token and the stock 24/7, but on weekends the stock itself cannot be bought or sold, and new issuance is priced off the previous business day’s reference price, so the cash leg of the arbitrage is cut. Ondo’s regular window runs from Sunday 20:05 to Friday 19:59 ET, and it also opens off-hours sessions token by token; outside market hours it quotes using a “proprietary pricing methodology” and sets a limit for each token. Ondo says TSLAon can be minted and redeemed on weekends, but its materials disagree on which tokens are 24/7 (the blog, the product page and the docs each say something different), so platforms should go by its terms of sale and the live status of its API.
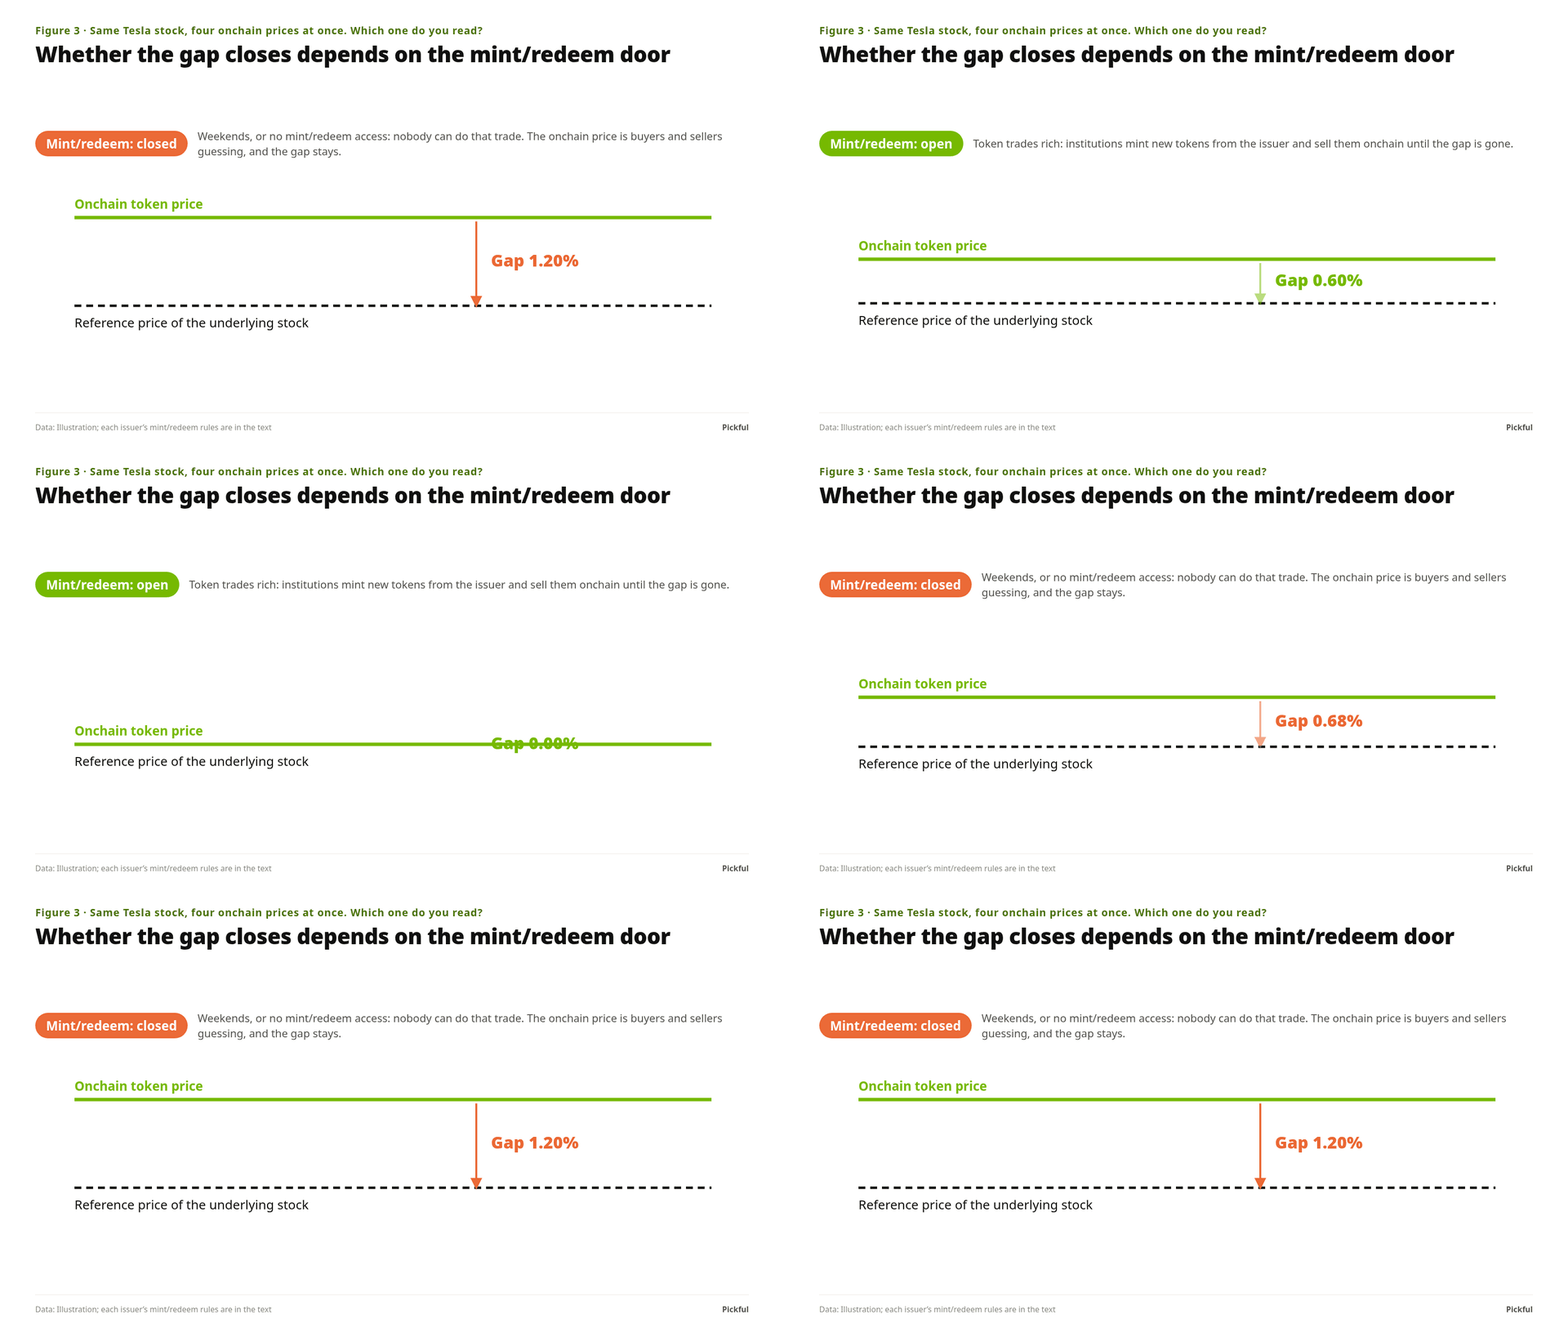
So over the weekend, only Ondo’s door may have been open. Looking back at Sunday’s numbers, the easy reading is this: Ondo was open on the weekend, so arbitrage pinned it near Friday’s close, just 0.06% off; the other three were closed, ranging from −0.31% to −0.54%, leaning toward the last Friday after-hours trade at $387.11.
That reading does not hold. About three quarters of the weight in DexScreener’s Ondo reading came from a USDC pool on Ethereum whose fee is 2% (read from the pool’s fee() onchain). Its last trade of the weekend was at 02:23 UTC on November 15, about 19.5 hours before the 21:48 snapshot, and the next one came 5 minutes after Monday’s open, about 36 hours with no movement. That +0.06% was a frozen price.
One layer down, the picture is more specific than “frozen”. We read every TSLAon mint and burn event and every trade in this pool between 01:00 UTC on November 14 and 01:00 UTC on November 16:
- The door was open, and people used it. Over the weekend there were 33 mints totaling about 933 tokens and 17 burns totaling about 23 tokens. Mints were concentrated on Saturday.
-
Almost every trade in the pool was “mint, then sell”. All 19 trades sold tokens into the pool, and 14 of them minted with Ondo and sold into the pool in the same transaction.
- Arbitrage stopped at the edge of the fee. Working from the amounts in each transaction, the mint price fell from about $385.71 to about $383.15 over Saturday (this is an estimate that does not deduct swap-route fees; it is not a quote published by Ondo), and sellers’ proceeds fell from $386.05 to $383.19. After the last trade, the pool’s marginal price was about 383.2 ÷ 0.98 ≈ $391. Selling any more would have netted less than the cost of minting, so the arbitrage stopped.
In other words, the pool price sat about 2% above Ondo’s own quote, and nobody had a reason to close that gap. Sunday’s +0.06% sat right on that line. Its closeness to Friday’s close was a coincidence and had nothing to do with “the door keeps the price tighter”. This only tests the upper bound: over the weekend there was not a single trade that bought from the pool and then redeemed, so this data cannot say where the lower bound is. “The longer the door is open, the tighter the price tracks” is still a reasonable hypothesis, but it has to be tested against the issuer’s own quotes and limits, not against a DEX’s last trade price.
One more detail to keep: by these estimates, Ondo’s Saturday quote was between $383 and $386, close to the stock’s first premarket trade of $385.40 at 4 a.m. on Monday. One weekend cannot show it is consistently accurate, but it does show the quote was not simply pinned to Friday’s close.
3. Two weekend days: how the prices moved
I started recording hourly from a little after 2 p.m. ET on Sunday, and by 3 a.m. Monday I had 15 snapshots (Robinhood from the 4th snapshot on).
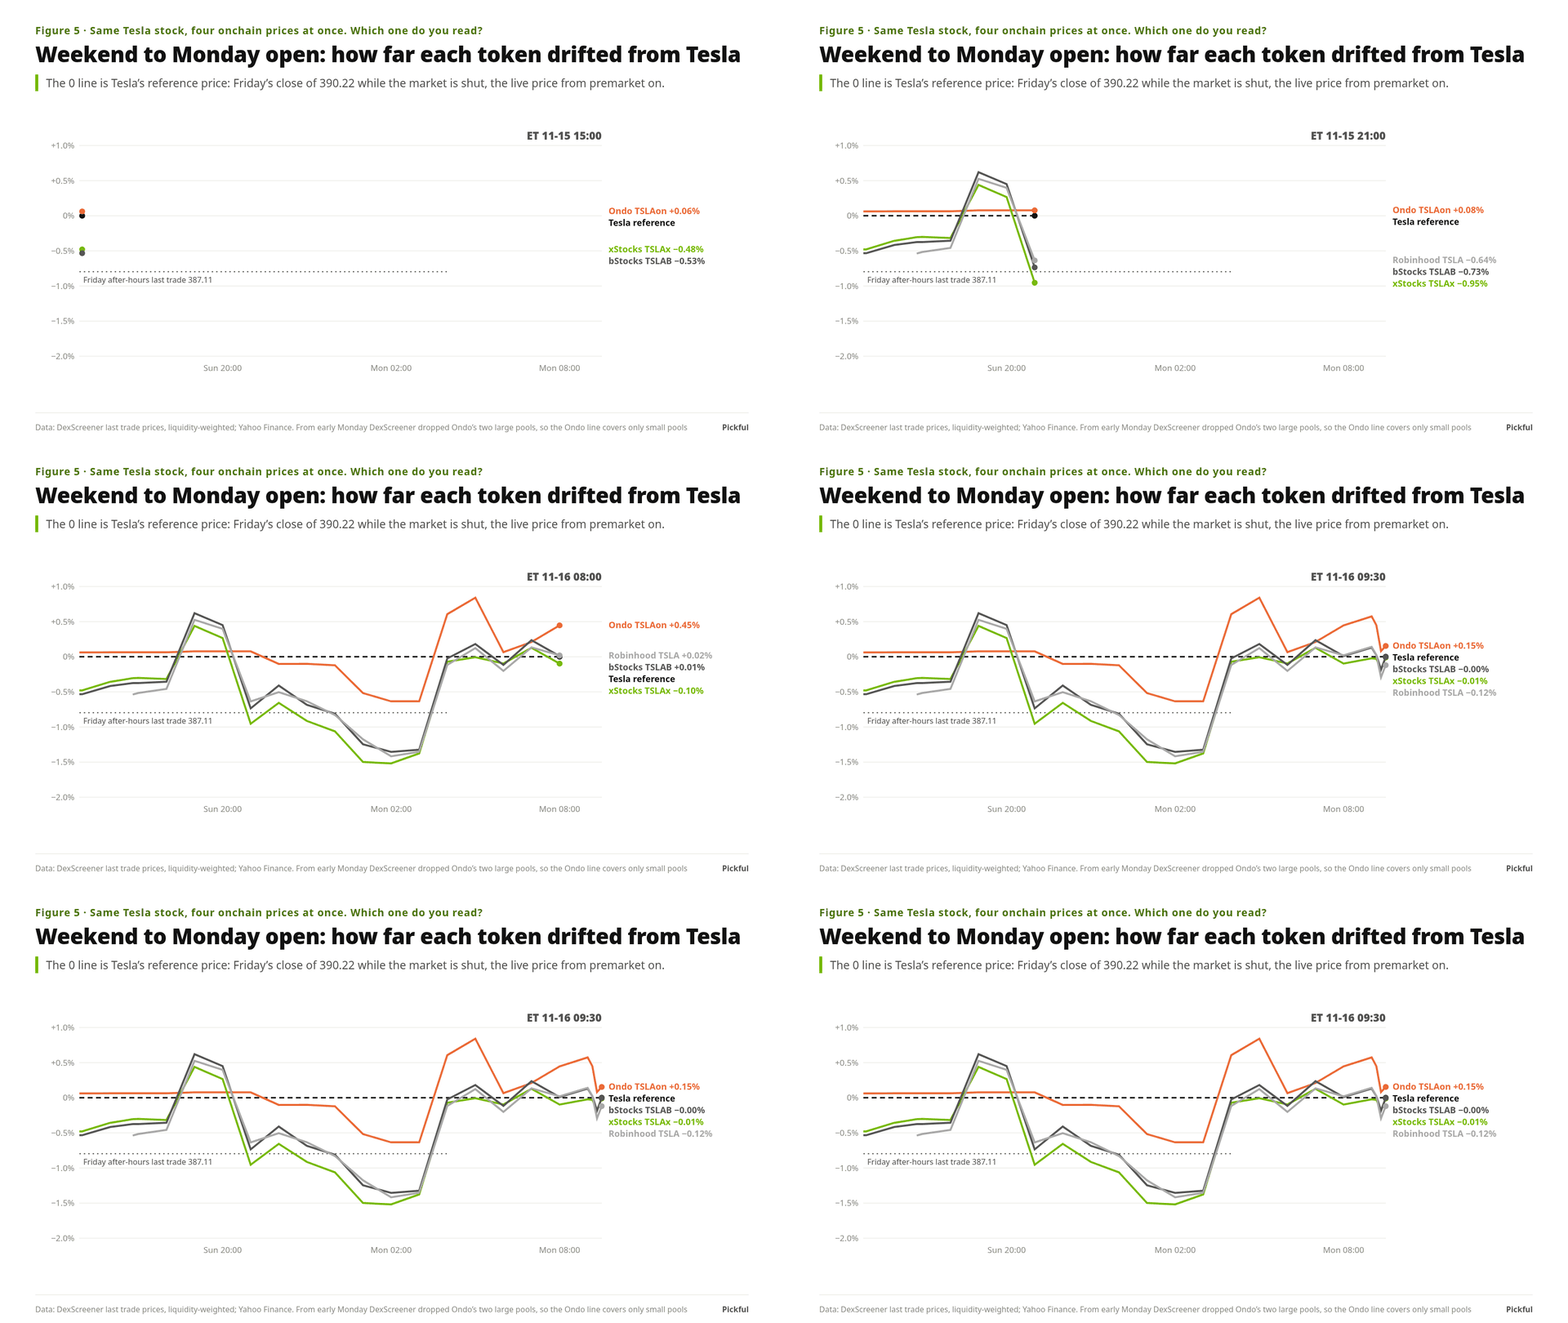
The three issuers with the door closed (xStocks, bStocks, Robinhood) moved almost identically. The gaps among the three were between 0.05% and 0.33%, much smaller than their deviation from the stock. Against Friday’s close of $390.22, their medians were −0.48%, −0.53% and −0.59%, with a range from −1.52% to +0.62%. If the reference is switched to Friday’s last after-hours trade at $387.11, the average deviation drops from 0.68%–0.75% to 0.47%–0.51%. This is one weekend, but the direction is clear: when an interface shows a reference stock price on weekends, the after-hours price is closer to what actually trades onchain than the close is, and the interface should say which one it uses.
The move had two parts. Around 7 p.m. ET on Sunday, all three rose together to 0.4%–0.6% above Friday’s close; from about 9 p.m. they fell back together, reaching −1.2% to −1.5% between 1 a.m. and 2 a.m. Monday. At 3 a.m. the three were between $384.85 and $385.05, and an hour later the stock’s first premarket trade was $385.40, less than 0.15% away from each of them. The outside cause of the three moving together could be stock perpetual futures or overnight trading, but we did not record those two prices over the same period, so this cannot yet be confirmed.
In all 15 snapshots, Ondo was the closest to Friday’s close, with a median of +0.06%. That line looks the steadiest, for the reason given in the previous section: until 9 p.m. ET on Sunday it stayed between $390.46 and $390.52, which was the frozen pool. After that it got worse: from 10 p.m. ET on Sunday until Monday’s open, the list of Ondo pools returned by DexScreener no longer included the two large pools. Counted liquidity fell from about $7.92 million to $130,000–$160,000, and the Ondo line was left with only the prices of a few small pools. We could not find out why. A system that watches only price, not pool count and liquidity, would have seen nothing wrong for those dozen-plus hours.
4. Monday’s open: how fast the gap closed
At the 9:30 a.m. ET open on Monday, the three closed-door issuers were already sitting next to the stock: xStocks −0.01%, bStocks 0.00%, Robinhood −0.12%. They had lined up during premarket, and the open itself brought no gap.
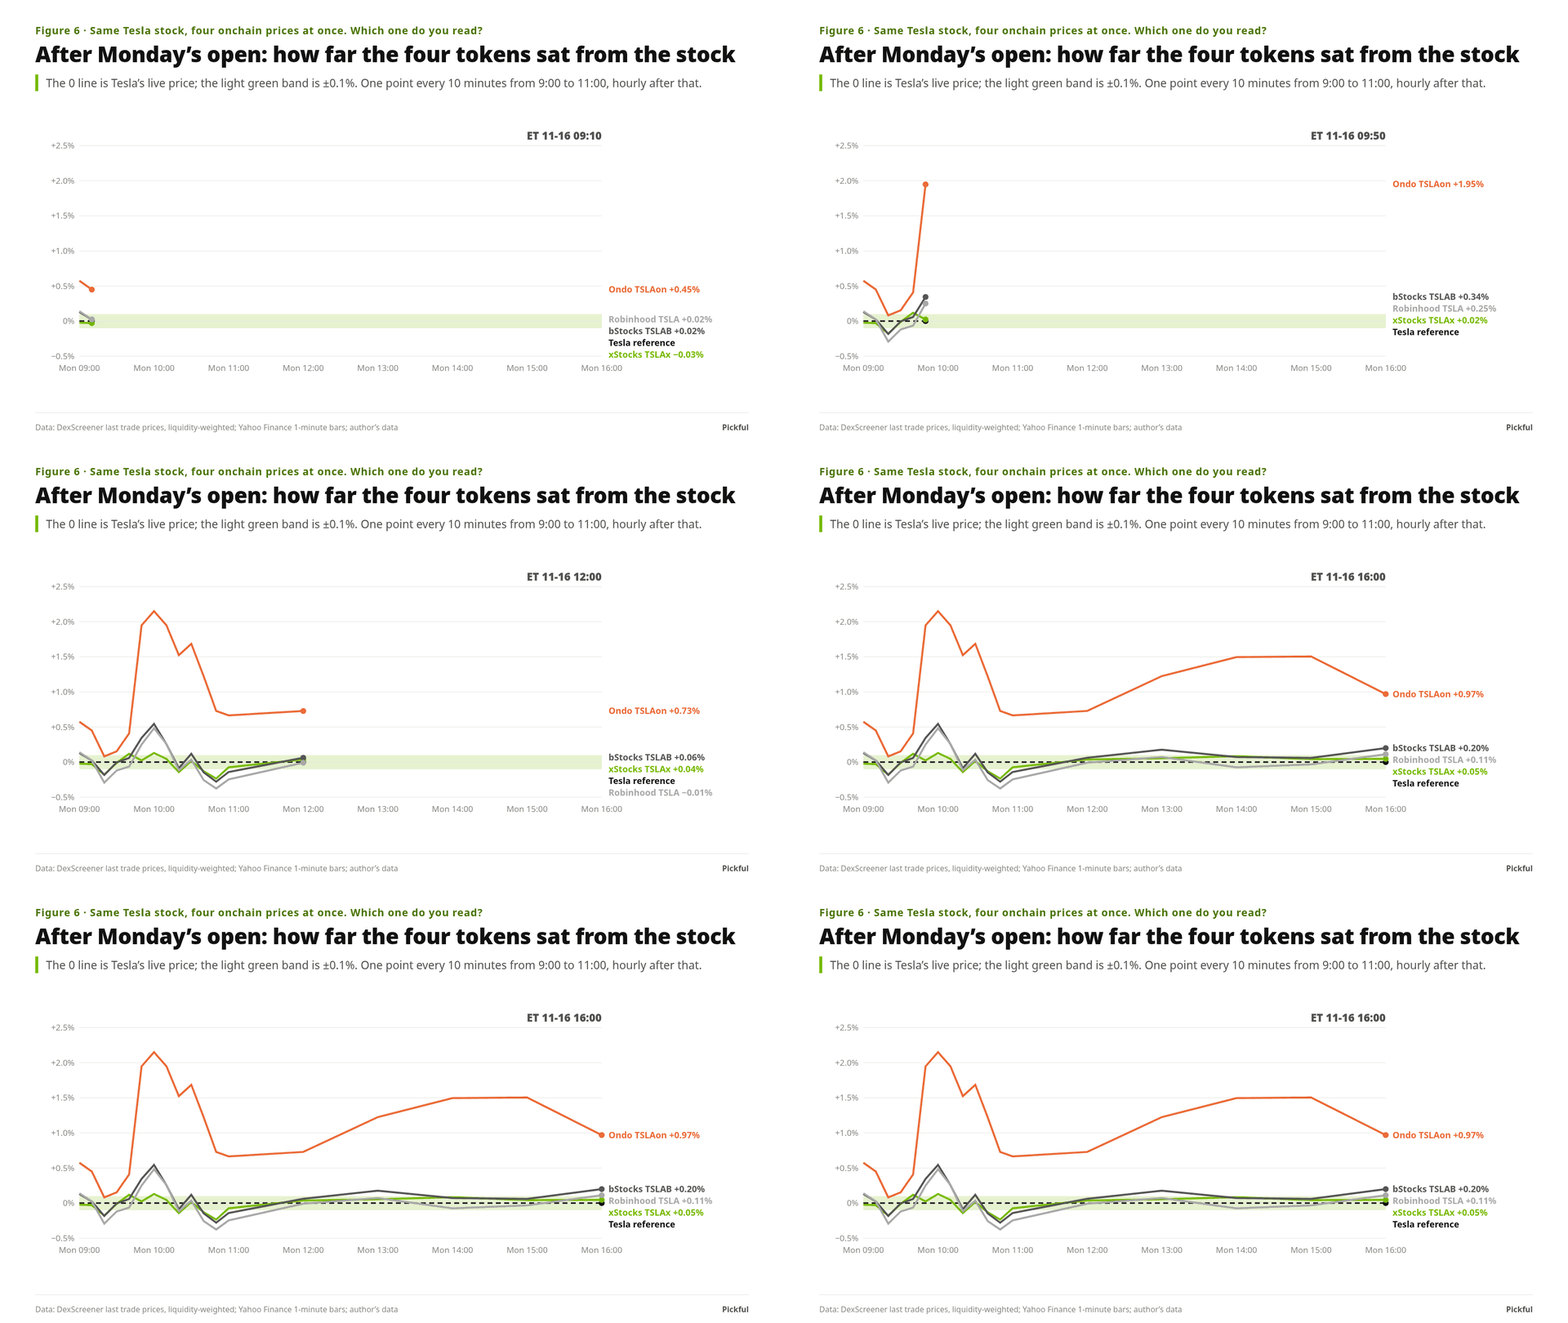
The largest deviations came in the first half hour after the open. From 9:40 to 10:10, the stock fell from $388.28 to $377.27, down 2.8%, and the three tokens lagged a step behind, hanging above the stock: at the 10:00 point, bStocks was +0.54% and Robinhood +0.48%. After that, each recovered differently. xStocks was back within ±0.1% from 11:00 and stayed there until the close; of the 14 snapshots after the open, 9 were within ±0.1%, with an average deviation of 0.08% and a maximum of 0.23%. bStocks and Robinhood returned to within ±0.1% between 11:00 and 12:00 (that stretch was sampled hourly, so it cannot be pinned to 10 minutes), stayed within 0.20% through the afternoon, and were within ±0.1% in 5 and 6 of the 14 snapshots respectively.
Ondo never came back. In the 14 snapshots after the open, it was between +0.67% and +2.15% against the stock, averaging +1.30%. The high of +2.15% came at 10:00, when DexScreener gave it a price of $386.69 against the stock’s $378.55. Yet between 10:00 and 10:01, someone made three sales into Ondo’s largest pool and received $379.26 to $379.57, only about 0.2% from the stock. That 2% existed only in the price field; nobody traded at it.
Two caveats on method. First, at one point every 10 minutes, the token price is DexScreener’s last trade price and the stock price is from Yahoo’s 1-minute bars, and a gap of a minute or two between them is common; when the stock is falling 1.6% in 10 minutes, a one-minute difference can mean 0.1%–0.2%, so these numbers are good for direction and sequence, not for single basis points. Second, Kraken says xStocks’ deviation at Monday’s open has historically been within 1%; on this day the three closed-door issuers’ maximum deviation was 0.54%, consistent with that claim, but Kraken has not published data.
5. Same issuer, different pools, different prices
There is a less visible kind of gap: between different trading pools of the same issuer on the same chain.
Ondo’s TSLAon has several USDC pools on Ethereum. At the same moment on Sunday, the largest pool (about $5.93 million in liquidity) had a last trade price of $391.00, while two small pools, one with a bit over $100,000 and one with tens of thousands of dollars, sat at about $387, a difference of about 1%, larger than the gap between the four issuers.
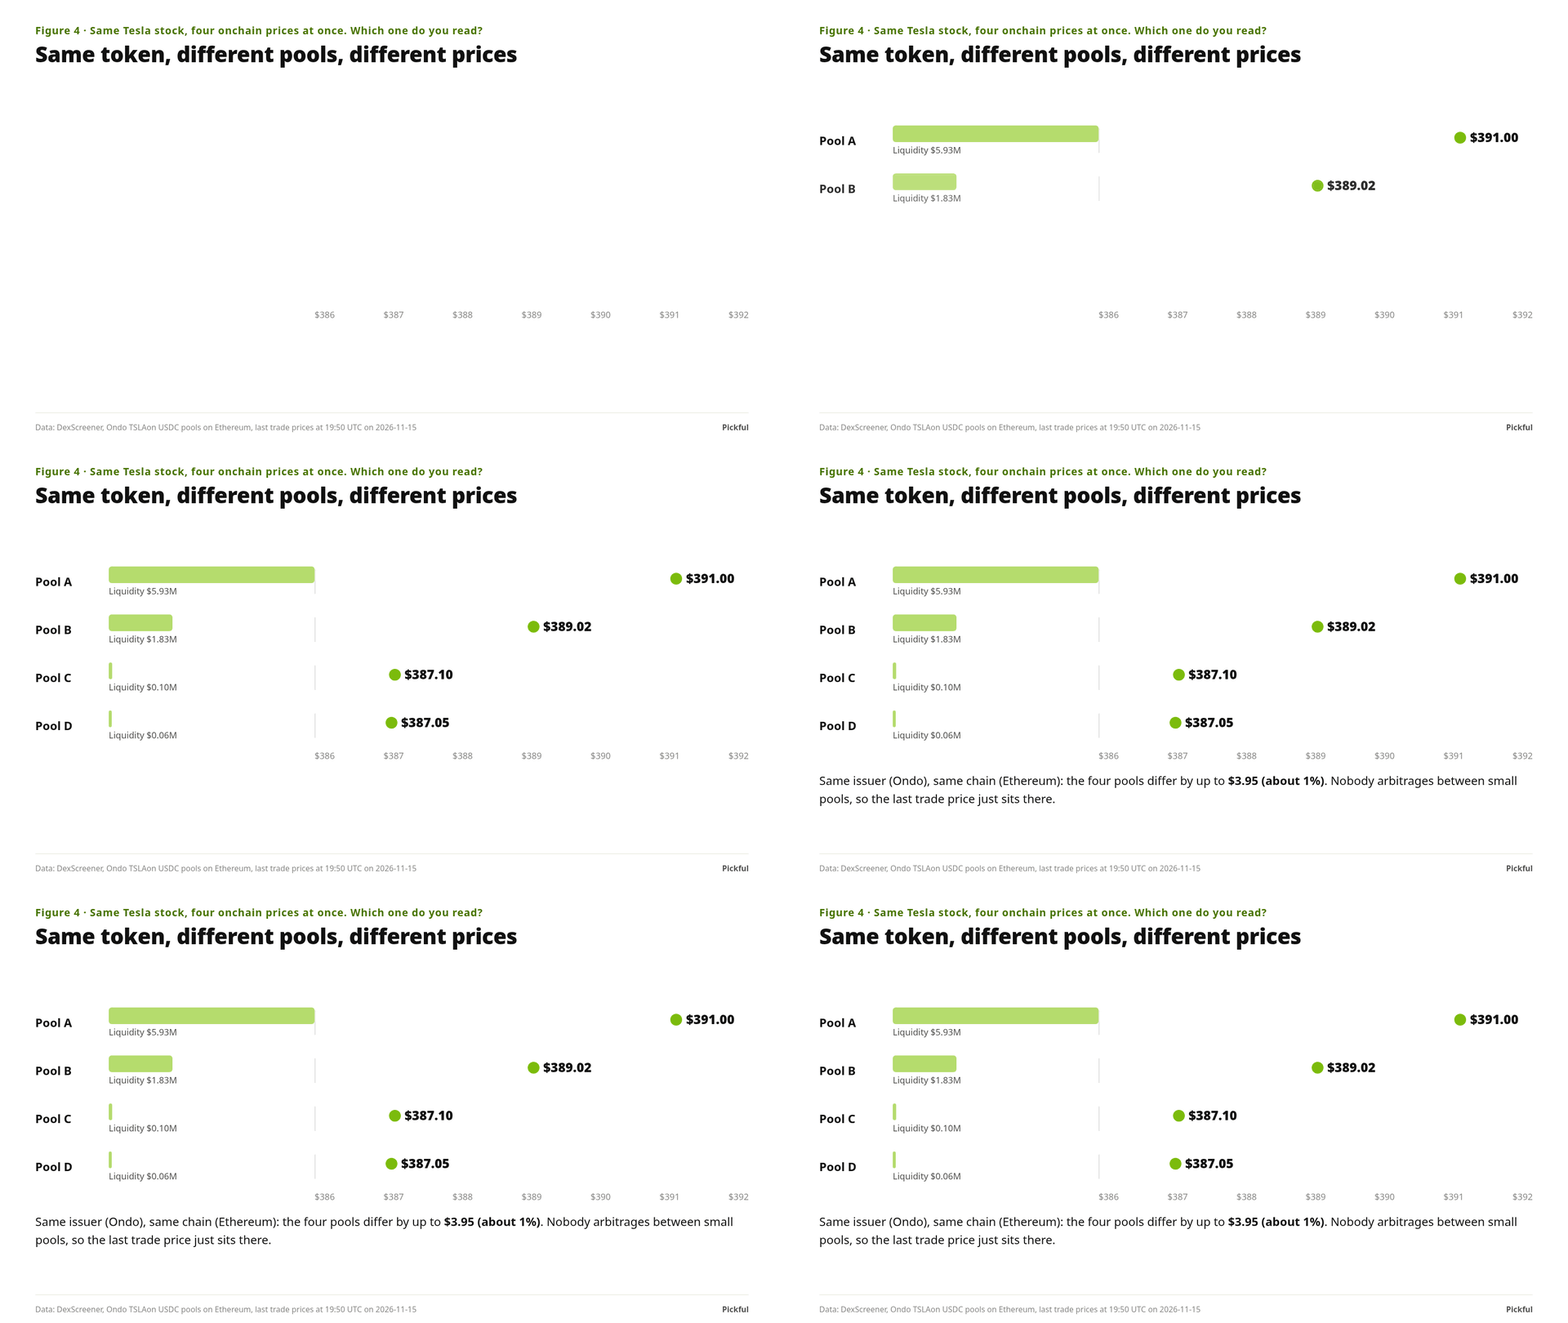
One reason is that nobody wants to arbitrage a pool holding a few tens of thousands of dollars, so the quote stays at whatever the last trade was. The other is fees: the largest pool charges 2%, the other two 1.5% and 1%. The higher the fee, the further a pool’s price can drift from the stock before anyone arbitrages it. On Monday, Ondo’s NVDAon had four pools on Ethereum with fees of 0.3%, 1%, 2% and 3%; their in-pool prices relative to the stock were, in that order, +0.9%, +1.2%, +2.2% and +3.0%, and their 24-hour trade counts were 288, 97, 52 and 5.
This is not just about Tesla. Shortly before 1 p.m. ET on Monday (17:57 UTC), I took the same snapshot for 10 tickers. For seven of them (Tesla, NVIDIA, Apple, Google, Meta, SPY and QQQ), Ondo’s Ethereum tokens were all between +1.0% and +1.9% against the stock; at the same moment, xStocks (Solana), bStocks and Robinhood were mostly within +0.5%, with the highest being xStocks’ SPY at +0.77%. Microsoft was the exception, with Ondo only 0.31% above. These numbers are not corrected for Ondo’s and xStocks’ dividend multipliers, so a small part of the deviation for dividend payers may come from the multiplier; Tesla pays no dividend and is not affected.
A pool’s price is also not a price you can trade at. Around midday the same day, we used the onchain pool state to simulate buying and selling $10,000: in Ondo’s 2% pool, buying cost 3.3% more than the stock, and selling fetched only 0.8% less. The +1.26% the pool displayed was neither the bid nor the ask. If a protocol’s price feed happens to read a pool like that, it sees Tesla as 1% to 2% more expensive than it is; if it reads a stalled small pool, it may see it 1% cheaper.
6. Four questions before you read a price
The points above come down to four questions you can ask of any stock token:
- What is the multiplier, and how does it change? Correct dividend payers for the multiplier first, or the gap is fake.
- How long since this price last traded? Attach the last trade time to every reading, and drop it when it exceeds a threshold. Sunday’s Ondo reading, the one closest to Friday’s close, was a trade from 19 and a half hours earlier; during the dozen-plus hours when DexScreener dropped the large pools, the price field still showed a number as usual. Also watch the pool count and counted liquidity: if either suddenly falls by an order of magnitude, stop using that round of readings.
- Which pool are you reading, and what is its fee? A 2% pool cannot carry the same weight as a 0.05% pool, and a small pool’s last trade price cannot be used as the price. For liquidation or as a trade reference, you need an executable quote for a set size and direction, not the in-pool price. During stock market hours, use the stock price times the multiplier as the anchor; if a token’s price deviates too far, treat it as a data problem first, not an arbitrage opportunity.
- Who is the mint/redeem door open to, and when? While the door is closed, the weekend price is only the secondary market’s guess. An open door only means arbitrage has a path; on that path there are still pool fees, the issuer’s quote spread and limits. In this sample, Ondo, with its door open, was the furthest from the stock in its pools. “The longer the door is open, the tighter the price tracks” has to be tested with the issuer’s own quotes and its mint and burn records, and we have not finished that work.
Anyone can look up the prices on a given day. The hard part is recording them weekend after weekend, with one consistent method, across several issuers. Only then do you know which issuer deviates year-round, by how much, how fast it comes back, and which readings stopped updating long ago. The quarterly tokenized stock monitor we are building does exactly that. If you want the first issue when it’s out, leave your email at asset.org/monitor.
#TokenizedStocks #RWA #xStocks
Data and sources (as of 2026-11-16):
- Onchain prices: DexScreener last trade price for each pool, counting only pools quoted in stablecoins (USDC, USDT; USDG on Robinhood Chain) with at least $1,000 of liquidity, removing outlier pools more than 3% away from the liquidity-weighted median (such as a pool on Robinhood Chain quoting $263), then weighting by liquidity. The four prices at the top are from 21:48 UTC on 2026-11-15; Figure 4 is from 19:50 UTC. Figures 5 and 6 and sections 3 and 4: the author’s monitoring file tsla_spread.csv, hourly from 19:54 UTC on 2026-11-15, every 10 minutes from 14:10 to 15:50 UTC on 11-16, through 22:00 UTC. xStocks always means TSLAx on Solana; an address on Mantle that calls itself xStocks (0x4368…1883) is not in the deployment list of the official xStocks API and has been excluded.
-
Tesla reference price: Friday 11-13 close $390.22, last after-hours trade $387.11; Monday premarket and intraday use the latest price from Yahoo Finance 1-minute bars (used only if there was a trade within 20 minutes, otherwise the most recent close).
- Multiplier: the Solana mint account of xStocks TSLAx, scaledUiAmountConfig.multiplier = 1.
-
Ondo pools and minting: all mint and burn events for TSLAon on Ethereum (0xf6b1…103f) from 01:00 UTC on 2026-11-14 to 01:00 UTC on 11-16, and all Swap events in the largest USDC pool 0xF200…28AD (public RPC eth_getLogs); pool fees read from each pool’s fee(): 0xF200…28AD 2%, 0x49b7…E988 1.5%, 0xfd62…3231 and 0x3122…95Da 1%; trades on 11-16 from GeckoTerminal’s trade list for that pool. Mint prices are estimates computed as “USDC in the transaction ÷ tokens minted”. Source: the source notes of chapters 3 and 4 of the author’s manuscript Listing Tokenized Stocks.
- Multi-ticker snapshot and NVDAon fee ladder: the author’s monitoring file stocks_spread.csv (17:57 UTC on 2026-11-16); token addresses from each issuer’s official list (Ondo docs token list, the public xStocks API, Binance asset configuration, Robinhood Chain asset registry API); the four NVDAon pools are DexScreener readings at about 18:01 UTC plus onchain fee().
-
Executable range: simulated pool by pool from onchain slot0, liquidity and ticks at about 17:51–17:56 UTC on 2026-11-16, including pool fees, excluding gas.
- Ondo minting and redemption: docs.ondo.finance/ondo-stocks (Market Hours, Off-Hours Trading, Investing & Redeeming); Ondo blog posts “Ondo Launches First 24/7 Minting and Redemption for Tokenized Stocks” (2026-06-25) and “What Sets Ondo Stocks Apart” (2026-10-21); product page ondo.finance/ondo-stocks (accessed 2026-11-16).
-
xStocks: xstocks.fi/partners/learn (individuals can mint and redeem directly, $5,000 minimum, 24/5, not available to US persons).
- bStocks: issuer BTech Holdings (Binance-affiliated, ADGM), Binance press release of 2026-06-12; BTech prospectus (eligible ADGM subscribers, issue price based on the previous business day’s reference price); Binance bStocks FAQ and landing page (24/7 conversion).
-
Robinhood: docs.robinhood.com/chain/stock-tokens (tokenization window Monday 02:00 to Saturday 02:00 CET, only authorized participants can subscribe); RHJ base prospectus (authorized participant Bitstamp Global Ltd). The TSLA contract 0x322F0929c4625eD5bAd873c95208D54E1c003b2d appears in the official Robinhood Chain asset registry API api.robinhood.com/rhj/assets (the data source for the docs.robinhood.com/chain/contracts page), checked 2026-11-16.
- Kraken: support.kraken.com/au/articles/xstocks-faq (xStocks’ deviation at Monday’s open “historically within 1%”).
-
Not verified: the outside cause of the three issuers moving together on Sunday evening ET (perpetual futures and overnight prices were not recorded over the same period); why DexScreener did not return Ondo’s two large pools from 03:00 to 14:30 UTC on 11-16; the specific values of Ondo’s off-hours quotes and limits; a binding list of Ondo’s 24/7 mint/redeem tokens.
- Limitations: a sample of one weekend and one Monday; the last trade price is not an executable price; 10-minute sampling, so token and stock prices may be taken a minute or two apart.
Repost this post?
Share with your followers.
Reply