
目錄(11 節)

·
Quoted 2% Above Tesla, Traded 0.2% Above: Which Price Should a Platform Read?

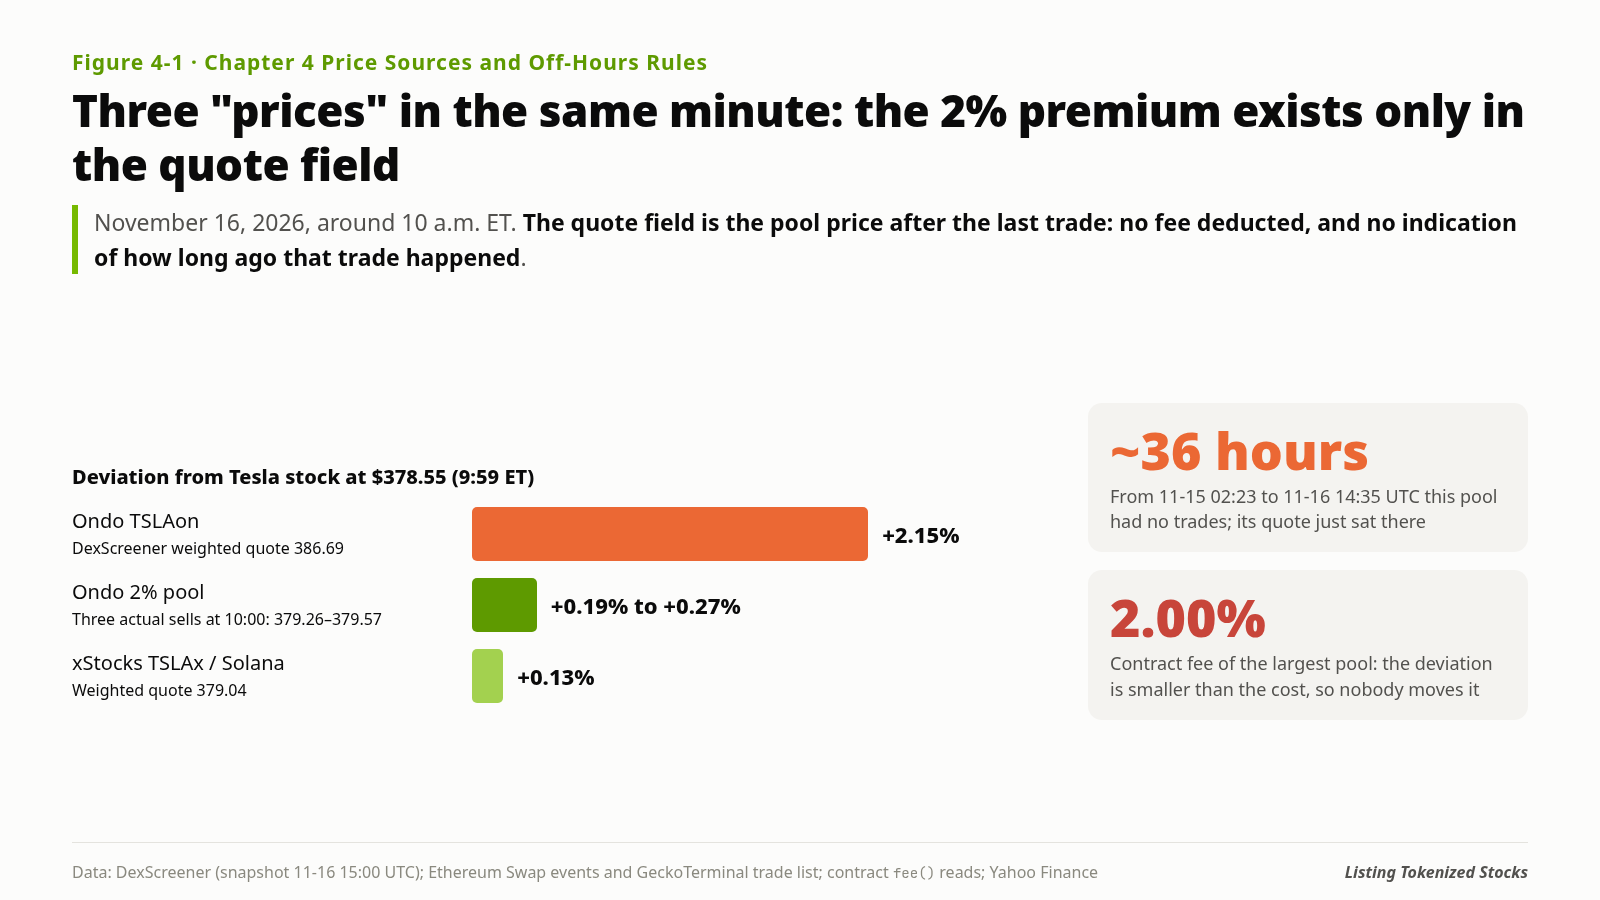
Monday, November 16, 2026, around 10 a.m. Eastern Time. Tesla stock traded at $378.55 (the 9:59 one-minute bar). At the same moment, DexScreener's liquidity-weighted price for Ondo's TSLAon (Ethereum) was $386.69, 2.15% above the stock. A system that reads only the "price" field would conclude that Ondo's Tesla token carried a 2% premium: an arbitrage opportunity, or a reason to lend holders a bit more.
Monday, November 16, 2026, around 10 a.m. Eastern Time. Tesla stock traded at $378.55 (the 9:59 one-minute bar). At the same moment, DexScreener’s liquidity-weighted price for Ondo’s TSLAon (Ethereum) was $386.69, 2.15% above the stock. A system that reads only the “price” field would conclude that Ondo’s Tesla token carried a 2% premium: an arbitrage opportunity, or a reason to lend holders a bit more.
Yet between 10:00 and 10:01, someone sold three lots of TSLAon into Ondo’s largest pool and received $379.26 to $379.57, only about 0.2% away from the stock. That 2% existed only in the quote field. Nobody traded at it.
The decision this piece asks you to make: for each of three uses (display, limit and execution reference, liquidation), which data source do you read; what rule applies in regular hours, pre-market, after-hours and the overnight session, on weekends and holidays, and in the first 30 minutes after the open; and what do you do when a price goes stale? Having all three uses read the same number is the most common mistake, and the most expensive.
1. Separate two things first: what you compare, and what the price is used for
The introduction’s “one door, three prices” needs to be split into two layers when it comes to reading prices. The first layer is what you compare. These are checks, not inputs for pricing:
- Against the underlying stock. The underlying is not a single number either. On Friday, November 13, Tesla closed at $390.22; the last after-hours trade was $387.11 (19:59 ET), a 0.8% difference; Monday’s first pre-market quote was $385.40 (04:00 ET). Before comparing, decide which session’s stock price to use, and convert by the token’s current multiplier.
- Across issuers. Ondo, xStocks, bStocks and Robinhood each issue a Tesla token. Across 38 snapshots from Sunday afternoon to after Monday’s close, excluding Ondo, the maximum spread among the other sources ranged from 0.05% to 0.48%.
- Across pools. The same token on the same chain can differ by 1% between pools. At 19:50 UTC on Sunday, Ondo’s largest pool (liquidity about $5.93 million) read $391.00, while two smaller pools sat around $387. Robinhood Chain’s TSLA has 30 pools, quoted against USDG, SPY tokens, WETH and others, each with its own price.
The second layer is what the price is used for: display (shown to users), limit and execution reference (quotes, price bands, market-maker scoring), and liquidation (mark price and liquidation triggers). Each use needs its own data source, session rules and staleness handling; Section 7 gives the complete specification table.
2. Before reading a price, ask three things: how much, buy or sell, and when
For a concentrated-liquidity pool, a DEX’s “price” field is the in-pool price after the last trade. It does not deduct fees and does not tell you how long ago that trade happened. What a platform actually needs is an executable quote: for a given size, a given side and a given moment, at what price can it trade?
Between 17:51 and 17:56 UTC on November 16 (around noon ET), we used on-chain pool state (slot0, liquidity, ticks) to simulate buys and sells of $10,000 and $100,000 in each pool, including the pool fee and excluding gas. For Solana we used Jupiter’s aggregated quote. The stock reference price was $379.69 (17:56).
- Ondo TSLAon 2% pool (Ethereum): In-pool price deviation: +1.26%; Buy $10k: +3.34%; Sell $10k: −0.79%; Buy $100k: +3.49%; Sell $100k: −0.94%
- Ondo TSLAon 1.5% pool (Ethereum): In-pool price deviation: +0.75%; Buy $10k: +2.33%; Sell $10k: −0.82%; Buy $100k: +2.77%; Sell $100k: −1.24%
- Robinhood TSLA 0.3% pool (USDG): In-pool price deviation: −0.06%; Buy $10k: +0.44%; Sell $10k: −0.56%; Buy $100k: +2.13%; Sell $100k: −2.40%
- bStocks TSLAB 0.25% pool (USDT): In-pool price deviation: +0.08%; Buy $10k: +0.42%; Sell $10k: −0.26%; Buy $100k: +1.24%; Sell $100k: −1.36%
- xStocks TSLAx (Solana, Jupiter aggregated): In-pool price deviation: —; Buy $10k: +0.14%; Sell $10k: −0.13%; Buy $100k: +1.03%; Sell $100k: −0.95%
- xStocks wTSLAx (Ink, 0.05% pool): In-pool price deviation: +0.15%; Buy $10k: +7.40%; Sell $10k: −6.61%; Buy $100k: Not fillable; Sell $100k: Not fillable
(All deviations are relative to the stock at $379.69. The simulations and the stock price were taken a few minutes apart, so differences of a few basis points should not be over-read. Centralized-exchange order books were tighter at 17:57: on Bybit, buying or selling $10,000 of TSLAX cost 2–3 basis points; on Binance, TSLAB cost 2–3 basis points.)
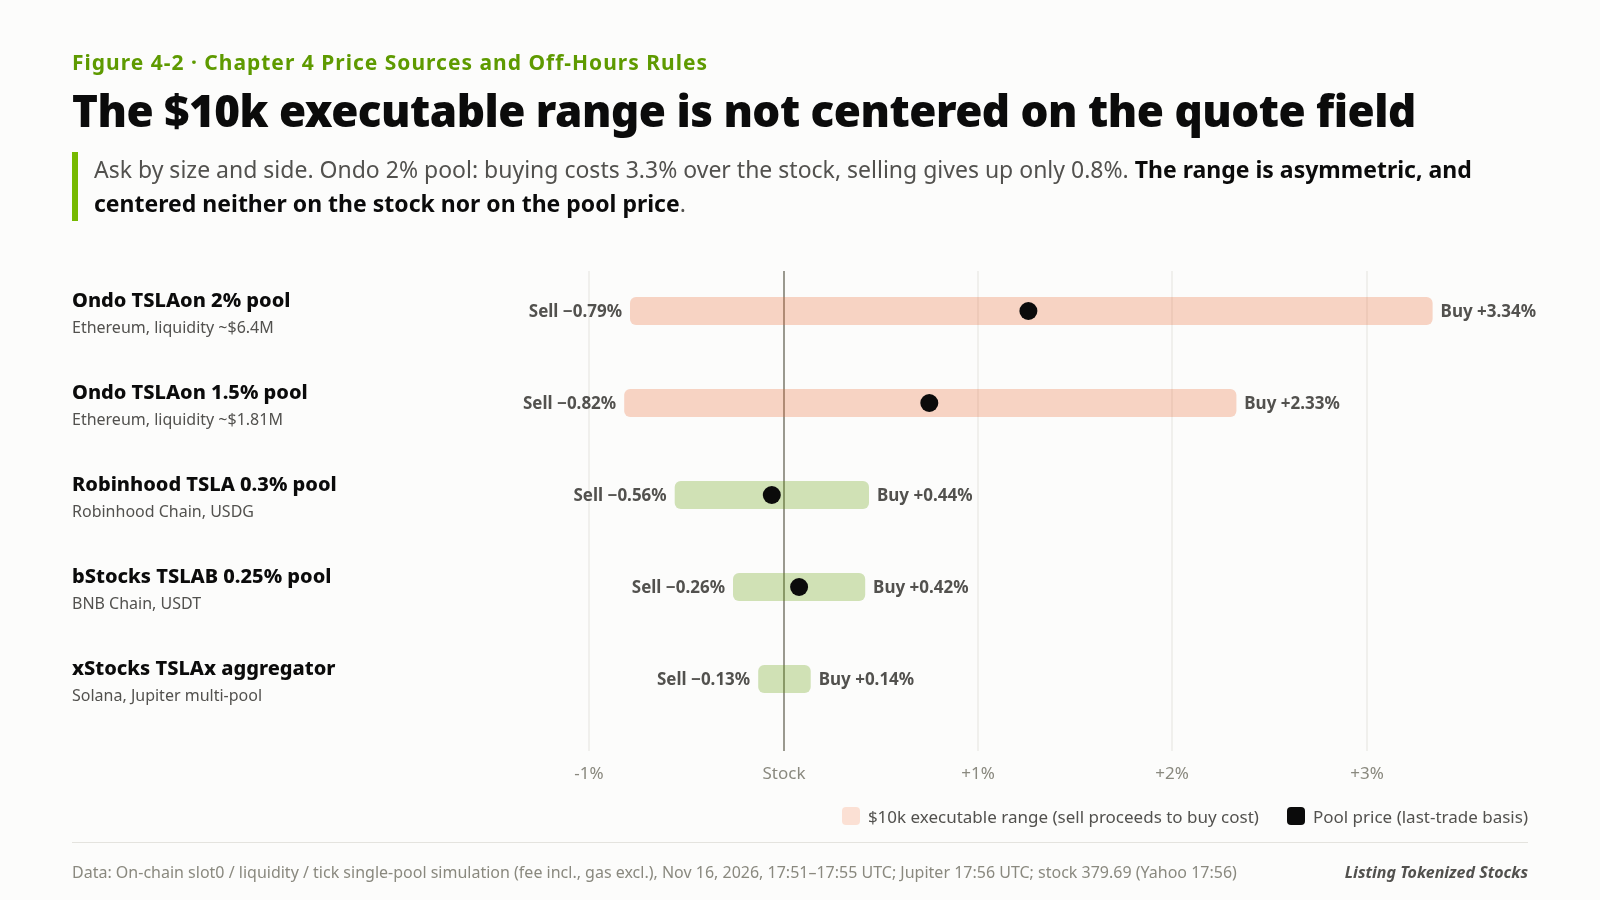
The table shows three things. First, the executable range is asymmetric: in Ondo’s 2% pool, buying $10,000 costs 3.3% over the stock, while selling gives up only 0.8%; the in-pool price of +1.26% is neither the bid nor the ask. Second, a quote that hugs the stock does not mean you can trade at it: the Ink pool’s quote was only 0.15% from the stock, yet buying or selling $10,000 cost about 7%. Third, change the size and the ranking changes: at $10,000 Robinhood was slightly worse than bStocks; at $100,000 it was much worse.
The last-trade price has a place in only one use: as a counterexample and an alert input. All of the following happened on the same day.
A pool that stopped trading. Ondo’s largest pool, 0xF200…28AD (2% fee), had its last weekend trade at 02:23 UTC on November 15 and its next one at 14:35 UTC on November 16 (5 minutes after Monday’s open). At the 21:48 UTC Sunday snapshot, the pool had gone about 19.5 hours without a trade; by 14:35 Monday, about 36 hours. Both durations refer to the same pool and the same type of trade (the pool’s Swap events), measured to different cut-off times. The two stretches of records come from different sources: from 01:00 UTC November 14 to 01:00 UTC November 16 we used the full set of on-chain Swap events; for November 16 we used GeckoTerminal’s trade list for the same pool. The two overlap between 17:50 UTC November 15 and 01:00 UTC November 16, and neither shows any trade in that window. The Ondo reading on Sunday that was “only 0.06% from Friday’s close” was the price at which this pool had stopped.
A fee ladder. At about 18:01 UTC the same day, Ondo’s NVDAon had four pools on Ethereum (stock at $156.39):
- 0.3%: In-pool price (USD): 157.74; vs stock: +0.9%; Trades in 24 hours: 288
- 1%: In-pool price (USD): 158.31; vs stock: +1.2%; Trades in 24 hours: 97
- 2%: In-pool price (USD): 159.84; vs stock: +2.2%; Trades in 24 hours: 52
- 3%: In-pool price (USD): 161.15; vs stock: +3.0%; Trades in 24 hours: 5
The higher the fee, the higher the in-pool price and the fewer the trades. In the 17:58 UTC multi-ticker snapshot, for seven tickers (TSLA, NVDA, AAPL, GOOGL, META, SPY, QQQ), Ondo’s Ethereum route was +1.06% to +2.00% above the stock, while other issuers at the same moment were mostly +0.1% to +0.8% (Ondo’s AAPL, GOOGL and QQQ pools had only $20,000 to $30,000 of liquidity; Ondo’s and xStocks’ dividend multipliers were not recorded this time).
A data source missing pools. From 03:00 to 14:30 UTC on November 16, the list of Ondo pools returned by DexScreener did not include the two large pools; the liquidity counted dropped from about $7.92 million to $130,000–160,000, and the pools reappeared from 14:40 UTC. We could not find the cause.
A parsing error. On November 16, DexScreener priced a TSLA/USDG pool on Robinhood Chain with about $140,000 of liquidity at $155.20; GeckoTerminal priced the same pool at $383.00.
Parsing errors can be blocked with a fixed rule: take only stablecoin-quoted pools with at least $1,000 of liquidity, remove pools more than 3% away from the liquidity-weighted median, and weight the rest by liquidity. Missing pools need an alert: if the number of pools counted or the liquidity counted suddenly drops by an order of magnitude, discard that round’s reading. Neither of these rules catches the first two cases: Ondo’s 2% pool accounts for about three quarters of the token’s reported liquidity, so if it is off, it is the median. Internal consistency checks can only find pools that “differ from the others”; they cannot detect that the largest pool has stopped. Three external checks are therefore needed: when the stock market is open, use the stock price (times the multiplier) as an anchor; attach the last trade time to every pool; and separate pools by fee tier, so a 2% pool does not get the same weight as a 0.05% pool.
3. A 2% pool fee is not a fixed “±2% no-arbitrage band”
Reading Ondo’s 2% pool fee as “a no-arbitrage band 2% either side of the stock” is a natural simplification, but it is not accurate. Arbitrage must be split by direction, and each direction has different cost items.
- Pool rich: sell into the pool: When it happens: When the in-pool price, net of the fee, is still above the cost of obtaining the token from the issuer; Arbitrage path: Mint from Ondo with USDC (via USDon), sell into the pool in the same transaction; Costs to cover: Pool fee 2% + slippage; Ondo’s buy-side quote spread; the cost of the USDC-to-USDon route; gas. Completed atomically, no hedge needed
- Pool cheap: buy from the pool: When it happens: When the in-pool price plus the fee is still below what redemption with the issuer would yield; Arbitrage path: Buy from the pool, redeem with Ondo into USDon, convert back to USDC; Costs to cover: Pool fee + slippage; Ondo’s redemption quote spread; USDon-to-USDC conversion depends on the conversion pool’s balance; may be rejected once the off-hours limit is used up
- Issuer’s door closed: When it happens: Either direction; Arbitrage path: Trade the token, hedge with the stock or stock perps, wait for the door to open; Costs to cover: Pool fee and slippage; hedging cost and basis risk; capital tied up until the door opens; on weekends the stock does not trade, so only perps are available
So the band has three features: its two edges are at different distances from the stock; it differs between weekends and trading hours (off-hours quote spreads are wider and limits apply); and when the issuer’s door is closed, hedging costs must be added. Summarizing it as “± the fee” overstates one side and understates the other at the same time.
How much can this sample verify?
- The upper edge was triggered once. From 01:00 UTC November 14 to 01:00 UTC November 16, this 2% pool had 19 trades, all selling TSLAon; 14 of them were in the same transaction as an Ondo mint. The sellers’ proceeds fell from $386.05 to $383.19. The mint price implied by “USDC in the transaction ÷ tokens minted” was about $385.71 at 16:12 UTC Saturday and about $383.15 at 22:12 UTC, almost identical to the sale proceeds; after the last mint, the pool’s marginal price was about 383.2 ÷ 0.98 ≈ $391. The arbitrage stopped near “mint cost ÷ (1 − fee)”, consistent with how the upper edge is computed. This inference does not deduct route costs or intermediate balances, so it is only an estimate.
- The lower edge was never reached. Of the 19 trades over the weekend and the 26 trades within 24 hours on Monday (sale prices $377.3 to $382.6, close to the stock), not one was a buy. How far the lower edge sits from the stock cannot be verified from this sample.
- The executable range during trading hours. In the simulation in the previous section, the $10,000 range for the 2% pool was −0.79% to +3.34% relative to the stock: centered about 1.3% above the stock, and about 4.1% wide.
The conclusion for platforms: readings from Ondo’s on-chain pools are not sufficient evidence that “24/7 creation and redemption makes prices track more tightly”. The door may hold the price well on the issuer’s side, but to reach the pool it has to pay a whole set of costs. To assess an issuer’s creation/redemption door, assess it together with the trading venue you actually connect to. Measuring the two edges requires buy and sell quotes and limits from Ondo’s quote API across different sessions, which we have not yet obtained.
4. Sessions: five states, plus a holiday calendar
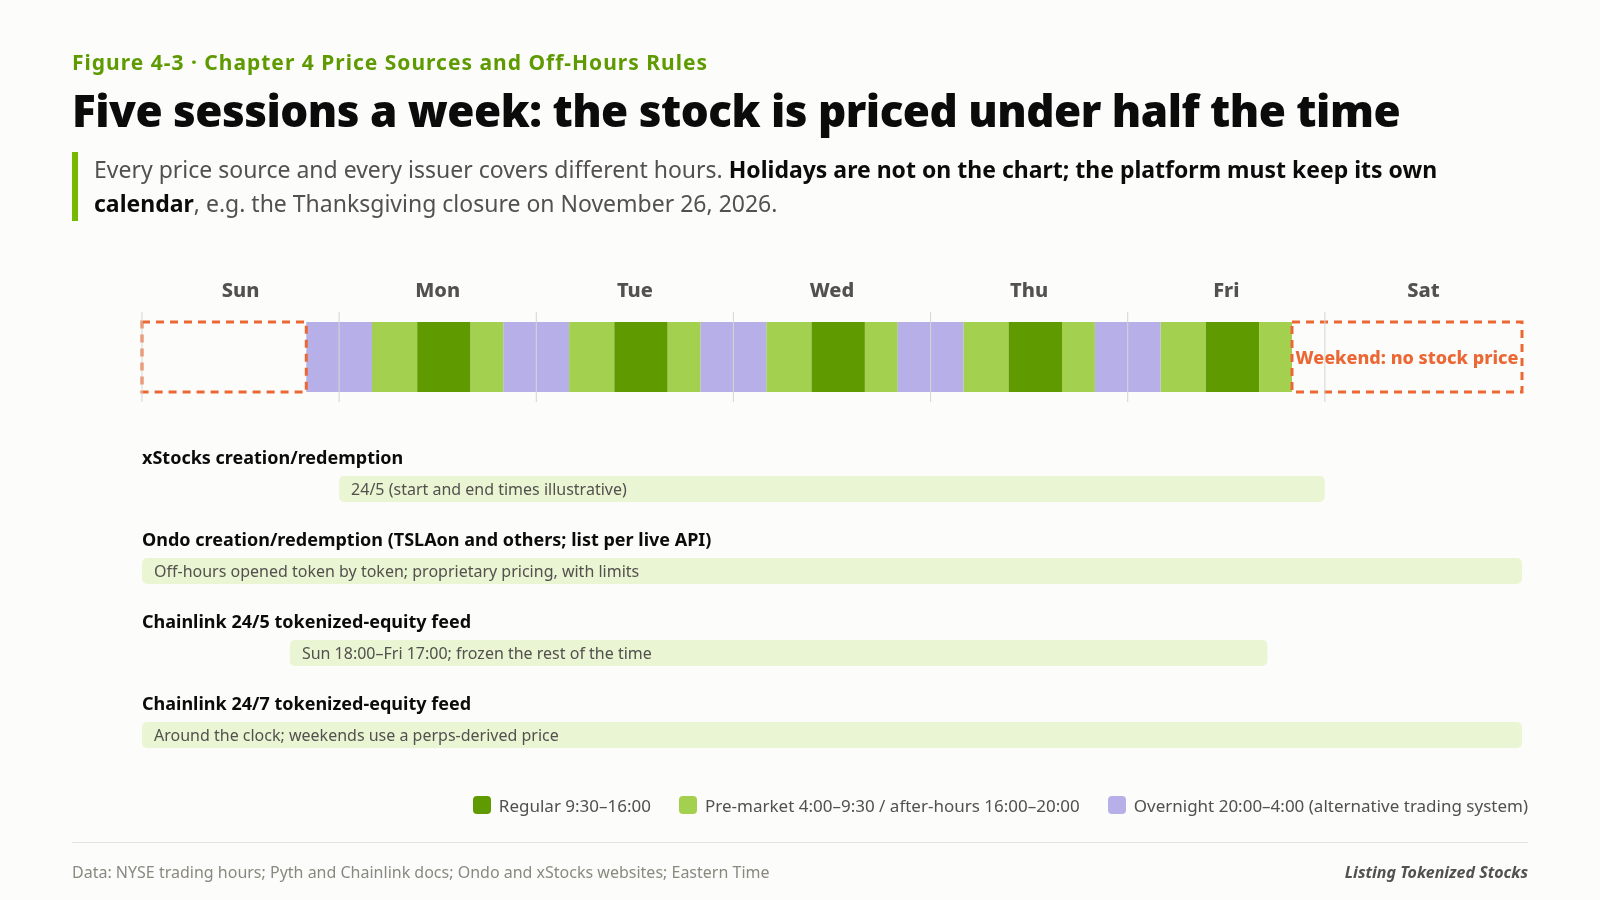
Every price source and every issuer covers different hours. In Eastern Time:
- Regular: Hours (ET): Monday to Friday 9:30–16:00; Does the stock have a price?: Yes, deepest; Price sources covering it: All sources
- Pre-market: Hours (ET): 4:00–9:30; Does the stock have a price?: Yes, shallow; Price sources covering it: Pyth, Chainlink 24/5, etc.
- After-hours: Hours (ET): 16:00–20:00; Does the stock have a price?: Yes, shallow; Price sources covering it: Same as above
- Overnight: Hours (ET): Sunday to Thursday 20:00–4:00 next day; Does the stock have a price?: Only on alternative trading systems (e.g. Blue Ocean ATS); Price sources covering it: Pyth overnight, Chainlink 24/5
- Weekends and holidays: Hours (ET): Friday 20:00–Sunday 20:00, and exchange holidays; Does the stock have a price?: No; Price sources covering it: Only sources that switch to off-exchange prices, such as Chainlink 24/7 and RedStone
Issuers’ creation and redemption are split along the same table. xStocks’ issuance and redemption are 24/5. Ondo’s regular window runs from Sunday 20:05 to Friday 19:59; off-hours are opened token by token, with quotes based on a “proprietary pricing methodology”, possibly wider spreads, and an off-hours limit for each token. Ondo’s own documents give different counts of 24/7 tokens (6, 25+, 32); the complete list is whatever the live API and the binding terms say.
Holidays need their own calendar entries. In 2026, Thanksgiving falls on Thursday, November 26: US stock markets are closed all day, and on Friday, November 27, they close early at 1 p.m. Chainlink’s 24/5 tokenized-equity feeds do not separately flag exchange holidays or trading halts, and the 24/7 feeds price holidays as off-hours without flagging them either. Only the platform can maintain this calendar.
5. Oracles: four things to get clear
Platforms that offer lending or derivatives usually read liquidation prices from an oracle. Here is how the three main oracle providers handle tokenized stocks, organized by the four things to check before listing (official documentation, checked November 16, 2026; details in the appendix at the end of this piece):
- Chainlink standard US equity feeds: Update hours: Weekdays 9:30–16:00; State when the market is closed: No updates; documentation says not to use outside the window; Multiplier handling: Not included; reads the stock price; Staleness handling: No session flag; the integrator judges by its own session table
- Chainlink 24/5 tokenized-equity feeds: Update hours: Sunday 20:00–Friday 20:00 (per the tokenized-equity feed page; the general market-hours table says Sunday 18:00–Friday 17:00); State when the market is closed: Frozen at the last update, no heartbeat; no flag for holidays or halts; Multiplier handling: Issuer feeds use “stock price × multiplier”; Staleness handling: Timestamp stops; the integrator runs staleness checks
- Chainlink 24/7 tokenized-equity feeds: Update hours: Around the clock; State when the market is closed: Keeps updating with an off-hours price synthesized from perpetual futures and smoothed; Multiplier handling: Corporate actions use regular-hours prices only; Staleness handling: Never frozen; any remaining gap is closed within a short window when trading reopens on Sunday
-
Chainlink Data Streams: Update hours: Standard streams 9:30–16:00; 24/5 version with finer session states; State when the market is closed:
marketStatusflags market closed; in the first 10–20 seconds after the open the price may still be the previous close; Multiplier handling: v10 “tokenized asset” format carries the stock price and the current and next multiplier (the 24/5 US equity streams themselves use v11); Staleness handling: Documentation says to judge bymarketStatus, not by timestamps -
Pyth: Update hours: Regular, pre-market, after-hours, overnight; State when the market is closed: Core has no session flag; Pro has
marketSession; Multiplier handling: Stock price feeds: the integrator applies the multiplier; there are also xStocks token price feeds, classified under “crypto”; Staleness handling: In Core,getPriceNoOlderThan()reverts when the price is too old - RedStone: Update hours: Around the clock; State when the market is closed: Off-hours, switches by a preset method to centralized-exchange derivatives and perps that trade around the clock; Multiplier handling: Documentation does not mention multipliers; treat as a stock price feed and apply the multiplier yourself; Staleness handling: The interface gives only a millisecond timestamp, with no session or staleness field; the integrator judges staleness
The differences among the three come down to one question: when the market is closed, do you want a frozen price or one that keeps moving? A frozen price is easy to audit and reconciles with the stock’s close, but it reflects no weekend news; however large Monday’s opening gap is, that is how many liquidations will bunch up at the moment of the open. A price that keeps moving lets risk release gradually over the weekend, but it comes from perpetual futures or on-chain markets: it is an estimate made without an anchor in the underlying, and different smoothing methods give different results. This choice has to be fixed before listing, not made on the spot during an incident.
6. This sample: one weekend and one Monday
The data come from the author’s on-chain monitoring (DexScreener last-trade prices per pool, using the same method as Section 2; the xStocks/Mantle column’s contract address did not match the official xStocks API and was excluded). Snapshots were taken hourly from 19:54 UTC on November 15, 2026, every 10 minutes from 9:10 to 10:50 ET on November 16, and hourly after that, through 22:00 UTC on November 16 (one hour after the US close). Note that this section uses last-trade prices, which are suitable for reading direction and timing but cannot be treated as executable prices.
- xStocks / Solana: Weekend: vs Friday close: 0.73%; Weekend: vs after-hours price: 0.51%; Pre-market: 0.07%; After the open: mean / max: 0.10% / 0.23%; Snapshots ≤0.1% (of 10 after the open): 5
- xStocks / Ink: Weekend: vs Friday close: 0.77%; Weekend: vs after-hours price: 0.47%; Pre-market: 0.05%; After the open: mean / max: 0.12% / 0.33%; Snapshots ≤0.1% (of 10 after the open): 7
- bStocks / BNB Chain: Weekend: vs Friday close: 0.68%; Weekend: vs after-hours price: 0.47%; Pre-market: 0.10%; After the open: mean / max: 0.20% / 0.54%; Snapshots ≤0.1% (of 10 after the open): 3
- Robinhood: Weekend: vs Friday close: 0.75%; Weekend: vs after-hours price: 0.47%; Pre-market: 0.13%; After the open: mean / max: 0.21% / 0.48%; Snapshots ≤0.1% (of 10 after the open): 3
- Ondo / Ethereum: Weekend: vs Friday close: 0.18%; Weekend: vs after-hours price: 0.70%; Pre-market: Missing pools, not counted; After the open: mean / max: 1.30% / 2.15%; Snapshots ≤0.1% (of 10 after the open): 0
(All figures are mean absolute deviations. 15 weekend snapshots, 12 for Ink and Robinhood; 9 pre-market; after the open, the 10 snapshots from 9:39 to 12:00 ET, each relative to the stock’s latest price in the same snapshot.)
A few key numbers. At 3 a.m. ET on Monday, before the stock had any quote, the four non-Ondo tokens were between $384.85 and $385.27; an hour later the first pre-market trade was $385.40, a gap of less than 0.15% for all of them. Throughout the weekend, the spread among these four sources was 0.05% to 0.33%, much smaller than their deviation from the stock. After the open, the stock fell 2.8% between 9:39 and 10:09, and the correlation between each 10-minute deviation and the stock’s move over the same interval was −0.55 to −0.83: when the stock fell fast, the tokens hung above it; when it rose fast, they lagged below. By noon ET all four were within 0.07% of the stock, while Ondo was still at +0.73%. In the afternoon (13:00 ET to the 16:00 close), all four were within 0.20% of the stock, with spreads of 0.11% to 0.17% among themselves; Ondo was between +0.97% and +1.50% and never came back near the stock for the entire trading day. One hour after the close, all four were still within 0.21%.
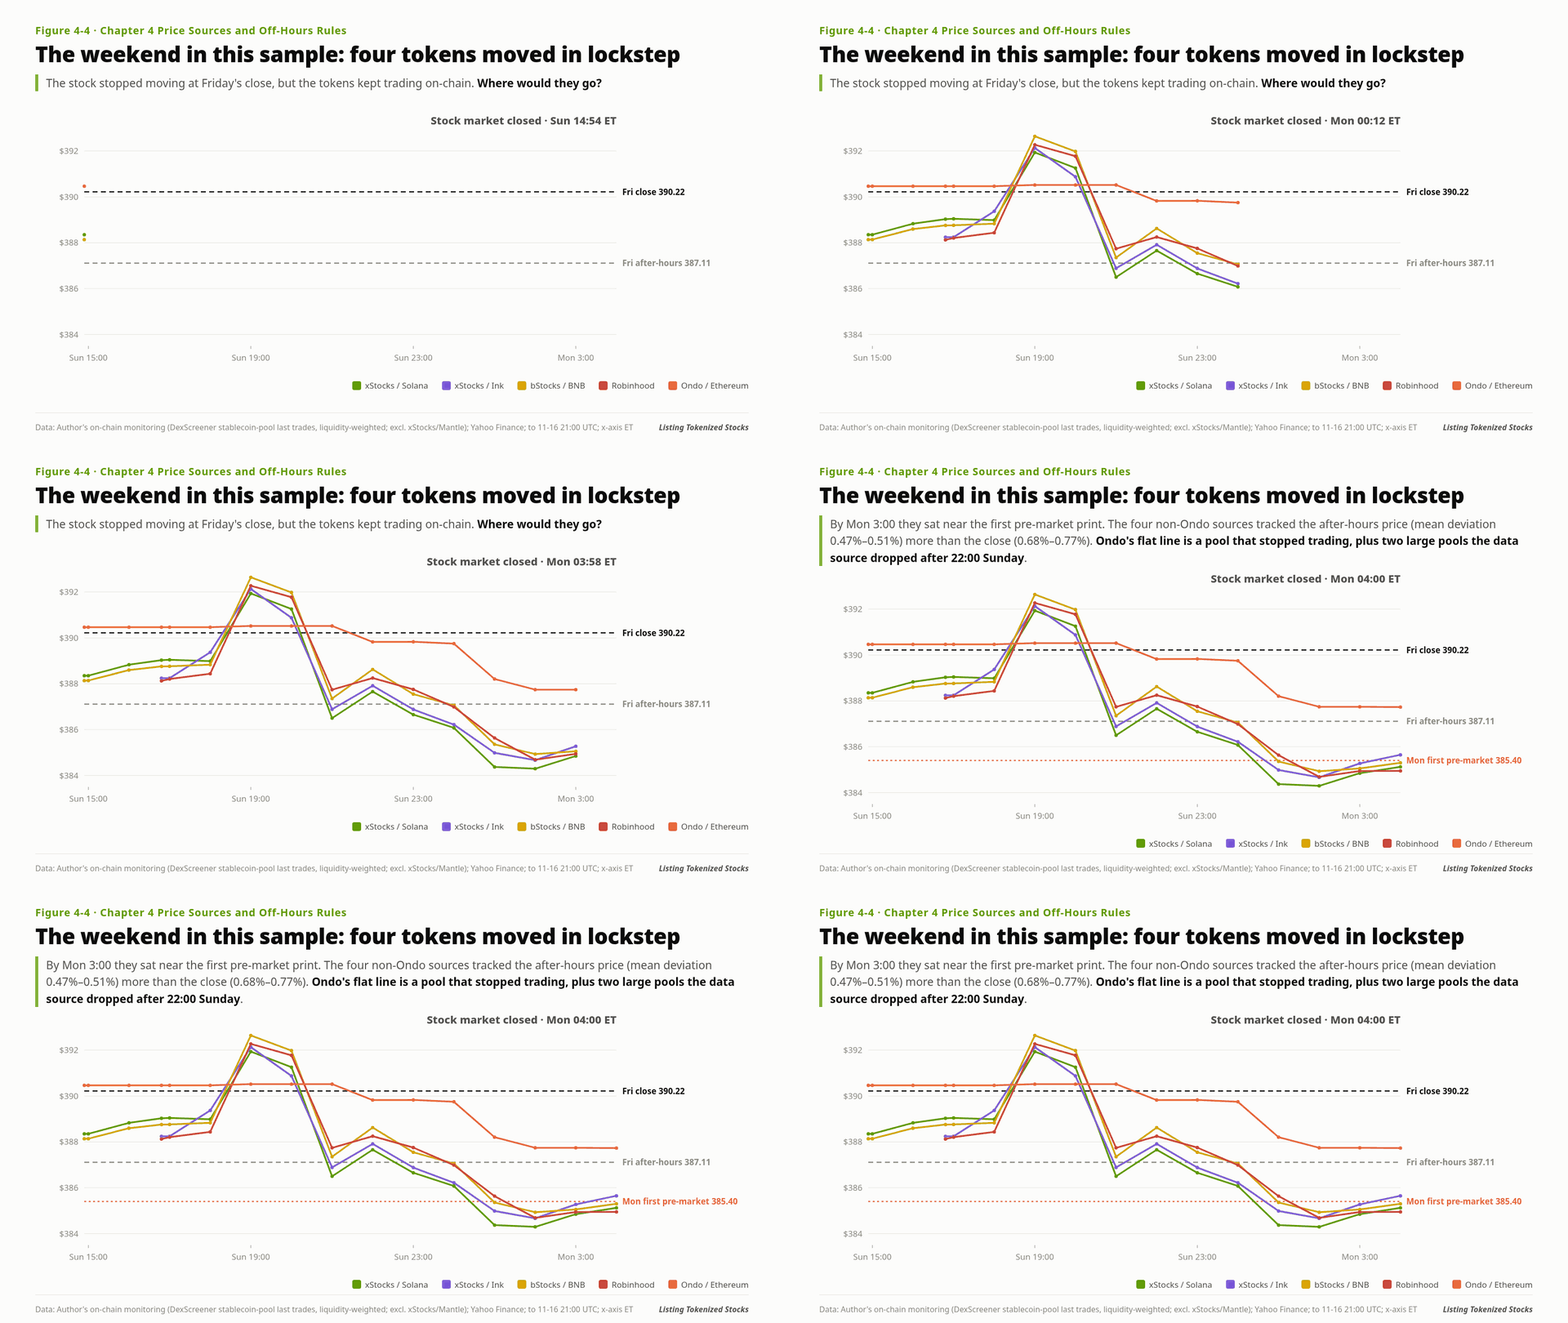
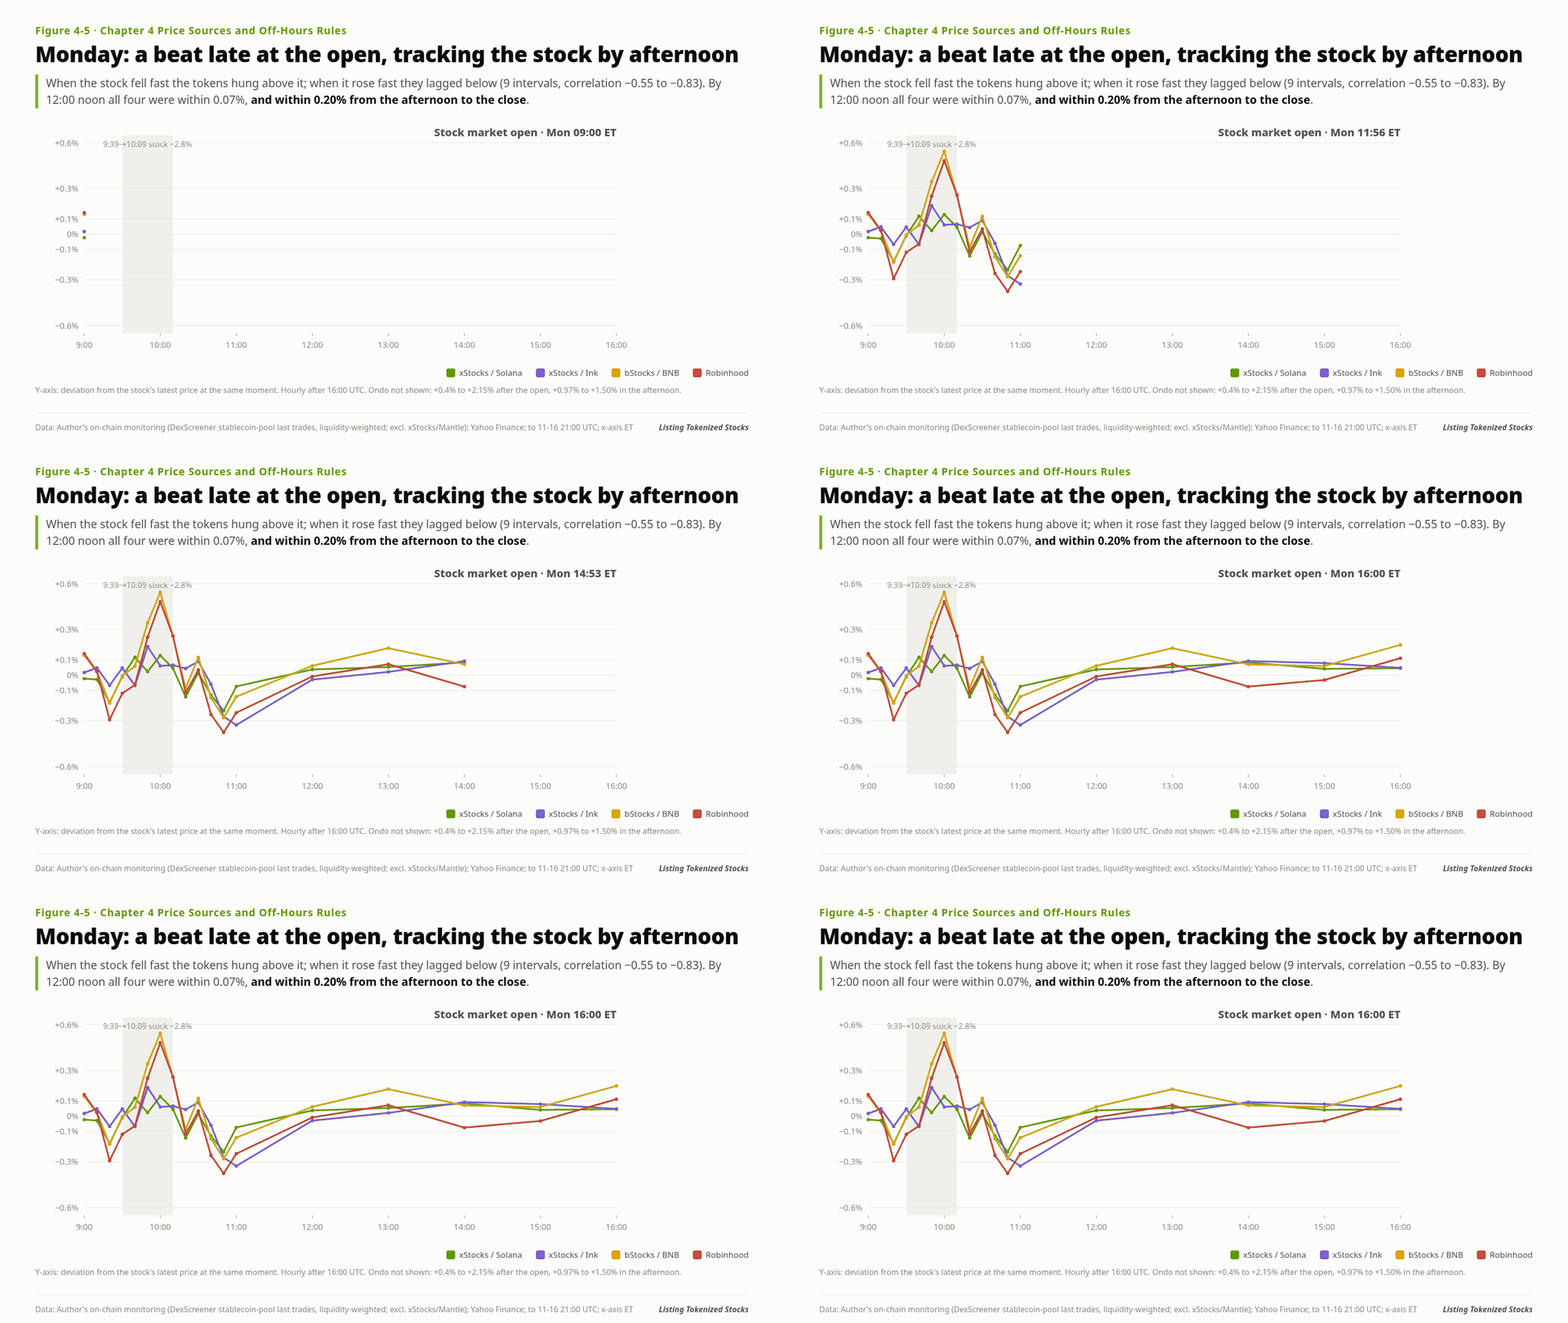
- Over the weekend the four non-Ondo sources were closer to the after-hours price (mean 0.47%–0.51%) than to the close (0.68%–0.77%): The after-hours last price is a better weekend reference than the close; whether this holds for stocks with thin after-hours trading
- The four sources moved together, with spreads of 0.05%–0.33% among them; by early Monday they were close to the first pre-market trade: Weekend on-chain prices follow stock perps or the overnight session (perp and overnight prices were not recorded for the same period); whether the directional signal is stable (RedStone’s own count over 449 weekends: Sunday-evening perp prices called the direction of Monday’s open correctly 65% of the time)
- Deviations were largest in the first 30 minutes after the open; tokens lagged when the stock moved sharply: How many minutes the lag lasts, and how it relates to depth and fees; 9 intervals can only show direction
- The Ondo reading was close to Friday’s close, behind which were a pool that stopped trading and missing pools: Whether Ondo’s quotes on the issuer’s side hug the stock (requires quote API data)
- No earnings: Earnings-day after-hours gaps and the size of token deviations (this sample cannot test it)
Kraken says xStocks’ deviation at Monday’s open “has historically been within 1%”. On this day the maximum deviation of the four non-Ondo sources was 0.54% (within half an hour of the open), consistent with that claim; Kraken has not published data.
7. Specification table: three uses, five sessions
First decide what each use reads and what to do when it goes stale:
- Display: Data source: Executable bid and ask at a typical order size on your venue or main route; next to it, the stock reference price and its session; Do not read: A single pool’s quote field; a “stock price” with no session label; Staleness handling: If not updated beyond the threshold, show “reference price is stale” and the time
- Limit and execution reference: Data source: Multi-pool executable quotes for a specified size and side, excluding anomalous pools and pools with no trades for a long time; in regular hours, the stock price (times the multiplier) as an external anchor; Do not read: The last-trade price of the pool with the largest reported liquidity; Staleness handling: Down-weight or exclude a pool with no trades beyond the threshold; if the anchor is stale, narrow the allowed order range
- Liquidation: Data source: An oracle with a session flag, plus your own staleness check and multiplier check; Do not read: DEX last-trade prices; oracle readings without a staleness check; Staleness handling: If stale, do not trigger liquidation; escalate to manual handling or pause new positions
Set thresholds from each pool’s normal trade interval and the oracle’s heartbeat; this series gives no single number. Then decide the rules for each session:
- Regular: Display: Executable price + live stock price; Limit and execution reference: Stock price as anchor; price band set by the token’s executable cost; Liquidation: Normal oracle readings
- Pre-market, after-hours, overnight: Display: Label “pre-market / after-hours / overnight reference price”; Limit and execution reference: Widen the price band one notch; anchor switches to the latest stock price; Liquidation: Depends on whether the oracle covers the session; if not, treat as market closed
- Weekends and holidays: Display: Label something like “US market closed; reference price is Friday after-hours 387.11 (close 390.22)”; Limit and execution reference: Widen the band further, lower per-order and daily limits; cross-issuer prices used only for alerts; Liquidation: Pick one of three (see below)
- First 30 minutes after the open: Display: Same as regular, labeled “early session”; Limit and execution reference: Keep the band at the market-closed setting until the oracle’s session switches to regular and has a fresh timestamp; Liquidation: Resume after the oracle’s session switches; do not trigger from on-chain prices
There are three ways to handle liquidation while the market is closed, each with a cost:
- Pause liquidations and resume at the open. Weekend losses are realized all at once at Monday’s open, and liquidations crowd into that moment. Suits lending protocols with conservative collateral ratios and small positions.
- Liquidate normally inside a band, pause outside it. While the market is closed, accept only prices within “last close ± band width”: inside the band, liquidate as usual; outside it, reject the price and pause liquidations until the market opens or a human confirms. This is what Kamino does: off-hours, it accepts the oracle price provided it falls within a custom deviation range around the last close (neither the governance forum post nor the documentation discloses the specific width for xStocks; ask the protocol directly). How wide the band should be requires data from many weekends.
- Keep liquidating on a continuously updated off-hours price (e.g. Chainlink 24/7). The outcome depends on the smoothing method, and thin markets can be pushed. Suits derivatives platforms and large positions that need risk released over the weekend.
Three operating rules run across all uses: convert by the multiplier before comparing (token unit price ÷ multiplier = price per share; stock price × multiplier = reference price per token unit), and check that the multiplier used by the oracle matches the one in the contract; store every price with three attributes: source, timestamp and session. “390.22” means nothing on its own; “stock, Friday regular-session close, Yahoo” does; treat earnings days and early-close days as off-hours, put them on the risk calendar, and tighten collateral ratios and per-order limits in advance; incident handling is covered in the piece on incident playbooks.
Ten questions to ask the issuer (or yourself) before listing
- Which provider and which product is the token’s official oracle? Which of the regular, pre-market/after-hours, overnight and weekend sessions does it cover? Does it freeze or keep updating when the market is closed?
- Does the price source carry a session flag? Are holidays and trading halts flagged? Does it pause during corporate actions, and is the pause flag enforced on-chain or merely advisory?
- Does the price source use the stock price times the multiplier, or the token’s market price? Where is the multiplier read from, and how are large changes handled?
- Which pools hold the main liquidity, and at what fees? At your typical order size, how much does a buy cost and how much does a sell cost? When was the last trade in the largest pool?
- How far apart are the issuer’s buy and redemption quotes in regular hours and off-hours? What is the off-hours limit? From these, how far is each arbitrage edge from the stock?
- What is your anomalous-pool filter? If the largest pool itself stops or deviates, is there an external anchor as a backstop? Is there an alert when the data source drops pools?
- Does the weekend stock reference price you display use the close or the after-hours price, and is that labeled in the interface?
- In the first 30 minutes after the open, what price do you use for liquidations and as the execution reference? Is there logic that waits for the oracle’s session to switch?
- Which off-hours liquidation approach did you choose? How many positions would have to be processed at once at the open?
- Are the data sources, session rules and staleness handling for display, execution reference and liquidation written into internal rules and user terms? Who has the authority to change them?
Conclusion
A tokenized stock has at least three comparable prices, and a platform has at least three uses for them. Before reading a price, be clear on: how much, buy or sell, when, and in which session. Sunday’s reading closest to Friday’s close came from a pool that had stopped trading about 19.5 hours before the snapshot and did not trade again until about 36 hours later, after Monday’s open. What it shows is that last-trade prices go stale, not that arbitrage was most active there. In this sample, the largest errors were not on the weekend but in the first half hour after the open.
Sources
- Author’s own monitoring:
tsla_spread.csv, hourly from 19:54 UTC on November 15, 2026, every 10 minutes from 14:10 to 15:50 UTC on November 16, through 22:00 UTC on November 16, 2026: 38 snapshots in total. Method:priceUsdper pool from DexScreener’stoken-pairsendpoint; only stablecoin-quoted pools (USDC, USDT, USDG) with liquidity ≥ $1,000; pools more than 3% from the liquidity-weighted median removed; the rest weighted by liquidity. The xStocks/Mantle column (0x4368…1883) is not in the deployment list of the official xStocks API api.xstocks.fi/api/v2/public/assets and was excluded. Windows: weekend 19:54 UTC November 15 to 08:00 UTC November 16; pre-market 09:00 to 14:30 UTC; after the open 14:40 to 21:00 UTC, plus one snapshot after the close at 22:00 UTC; the lag test uses 10-minute deviations from 14:30–16:00 UTC against the stock’s move over the same intervals. Stock prices: Yahoo Finance TSLA one-minute bars (including pre-market and after-hours). November 16 is in US Eastern Standard Time, UTC−5. - Executable quotes:
review/sources/depth_1116/amm_results_1751-1755UTC.txt(single-pool simulation of Ethereum, Robinhood Chain, BNB Chain and Ink pools from on-chainslot0/ liquidity / ticks,sim2.py; Ondo 1% pool cross-checked with Uniswap QuoterV2; Jupiter aggregated quote at 17:56 UTC);depth_snapshot_1758.txt(order books of Bybit, Binance and others, 17:57 UTC). - Author’s multi-ticker monitoring:
stocks_spread.csv, snapshot at 17:58 UTC on November 16, 2026 (same method as above; token list instocks_tokens.json). Robinhood deviations converted using themultipliercolumn; Ondo and xStocks not converted for multipliers. - Ondo TSLAon pool contract reads (Ethereum,
fee(),slot0(), around 17:52 UTC on November 16, 2026): 0xF2006D44339E5C2c479d450a97884d4E20D028AD (2%), 0x49b7b66457297f9E0E763BBb151B6DB0c149E988 (1.5%), 0xfd62Ce2489f37B9357CD1Aa66a33351580B33231 (1%), 0x31227b50eCCDC9C589826AA2D9E7C5619B1895Da (1%). - Trades in Ondo’s largest pool: the full set of on-chain
Swapevents from 01:00 UTC November 14 to 01:00 UTC November 16 (19 trades, all sells, last one at 02:23 UTC November 15) and TSLAon mint and burn events over the same period, see the piece on creation and redemption’s sources andreview/sources/mint_1116/; November 16 trades from GeckoTerminal’s trade list for the pool (queried around 17:50 UTC,review/sources/dl/ondo_trades.json, 26 trades, all sells, earliest at 14:35:11 UTC). - Ondo NVDAon Ethereum pools: DexScreener readings at about 18:01 UTC, contract
fee(): 0xc9b4bC7C… (0.3%), 0xFD4414D7… (1%), 0x6eE97deA… (2%), 0xD79A6821… (3%). - Spread between pools of the same issuer (391.00 vs about 387): trial calculation at 19:50 UTC on November 15, 2026 (the author’s internal working note, “2026-11-15 TSLA spread trial calculation”).
- Parsing error: Robinhood Chain pool 0x99932C7660dD58cf19f0e82e97F288d88d033480, DexScreener 155.20, GeckoTerminal 383.00 (November 16, 2026).
- Chainlink (checked November 16, 2026): docs.chain.link/data-feeds/selecting-data-feeds; docs.chain.link/data-feeds/tokenized-equity-feeds and its /24-7, /ondo and /robinhood subpages; docs.chain.link/data-streams/market-hours; report formats v8, v10, v11 (docs.chain.link/data-streams/reference/); docs.chain.link/data-streams/rwa-streams/24-5-us-equities-user-guide; docs.chain.link/data-streams/developer-responsibilities.
- Pyth: docs.pyth.network/price-feeds/core/market-hours, docs.pyth.network/price-feeds/best-practices; the Blue Ocean partnership and the June 15, 2026 migration announcement (pyth.network/blog); insights.pyth.network.
- RedStone: redstone.finance/blog/redstone-live-powers-entropy-pre-ipo-and-rwa-markets-on-hyperliquid; redstone.finance/research/tokenized-stocks-2026.
- Issuers: xStocks launch announcement xstocks.fi/news/xstocks-are-going-live-tokenized-stocks-for-the-defi-era, issuance and redemption hours xstocks.fi/us/partners/learn; Ondo’s adoption of Chainlink (February 11, 2026) ondo.finance/blog/defi-adoption-of-ondo-tokenized-stocks-live, ondo.finance/global-markets, docs.ondo.finance/ondo-stocks/off-hours-trading; Robinhood Chain docs.robinhood.com/chain/stock-tokens, docs.robinhood.com/chain/oracles-and-price-feeds.
- NYSE 2026 holidays and early closes: ICE press release “NYSE Group Announces 2026, 2027 and 2028 Holiday and Early Closings Calendar” and nyse.com/markets/hours-calendars (checked November 16, 2026).
- Kraken: support.kraken.com/au/articles/xstocks-faq. Kamino: gov.kamino.finance forum post “Kamino is integrating xStocks powered by the Chainlink data standard”.
Not yet confirmed:
- Buy and sell quotes and limits from Ondo’s quote API in regular hours and off-hours (needed both to measure the two arbitrage edges and to tell “stale” apart from “genuine premium”).
- The mint prices in Section 3 are inferred as “USDC in the transaction ÷ tokens minted”, without deducting the cost of the USDC-to-USDon route or intermediate balances.
- Why DexScreener did not return Ondo’s two large pools between 03:00 and 14:30 UTC on November 16 (only the phenomenon was observed).
- The external cause of the four issuers rising together around 19:00 ET on Sunday and falling back together after 21:00 (perp and overnight prices were not recorded for the same period).
- After-hours gaps and token deviations around past TSLA earnings releases (this sample contains no earnings).
- The specific width of Kamino’s off-hours deviation band (not disclosed in the forum post or documentation; Scope’s generic default tolerance of 5% for reference prices should not be taken as this width).
- RedStone: the switch to derivatives off-hours is confirmed by official documentation; session flags, multipliers and staleness fields do not appear anywhere in the interface documentation (docs.redstone.finance checked November 16, 2026).
- Which issuer Chainlink’s v10 report format corresponds to (the official documentation does not name one; xStocks uses Chainlink as its official oracle, but the documentation does not link v10 to it).
- In the multi-ticker snapshot, Ondo’s and xStocks’ dividend multipliers were not recorded, so the share of Ondo’s deviation on dividend-paying stocks that comes from the multiplier was not separated out (TSLA pays no dividend and is unaffected).
- Chainlink’s own documents are inconsistent: the general market-hours table for Data Feeds says Sunday 18:00–Friday 17:00, while the tokenized-equity feed page and Data Streams say Sunday 20:00–Friday 20:00. When integrating, go by the page for the specific feed you actually use.
Appendix: oracle details
- Issuer choices. In its launch announcement, xStocks named Chainlink as its official oracle and integrated proof of reserves; Ondo announced in February 2026 that it would adopt the Chainlink data standard as its official oracle; Robinhood Chain’s documentation states that stock token prices are brought on-chain through a separate Chainlink price feed for each asset.
-
Chainlink multipliers and pauses. Ondo’s price feeds are computed as “stock price × multiplier (sValue)”; multiplier changes of no more than 1% in a day take effect automatically, while changes above 1% require a scheduled pause window announced at least 24 hours in advance, during which the price is frozen at the last normal value. When Robinhood handles a corporate action it pauses the corresponding price feed, readable on-chain via
oraclePaused(), but the documentation states that this flag is advisory only and not enforced on-chain: a paused feed may still return values, so integrators should rely primarily on their own staleness checks. - Chainlink 24/5 feeds. Cover regular, pre-market, after-hours and overnight sessions; publish no updates while the market is closed, with the timestamp stopping at the last update before the close; the last value is not necessarily equal to the exchange’s official closing price.
-
Chainlink Data Streams. When the market is closed (including weekends and holidays), standard US equity streams report
marketStatus5; the 24/5 version breaks the state down into pre-market, regular, after-hours and overnight, and the documentation says to switch between streams based on this field. For the first 10–20 seconds after the open (possibly several minutes for illiquid stocks), quotes may still be stuck at the previous close. The v10 format contains the stock priceprice,currentMultiplier,newMultiplier, andtokenizedPrice, the aggregated price of the token on centralized exchanges; the documentation warns thatpricegoes stale while the market is closed. - Pyth. Overnight data comes from Blue Ocean ATS and follows Blue Ocean’s holiday schedule; from June 15, 2026, session-specific US equity prices for pre-market, after-hours and overnight moved from the free Core tier to the paid Pro tier. Pyth’s best-practices documentation recommends that when prices are frozen by a market closure while trading continues, integrators pause new positions or switch to conservative pricing.
- RedStone. Uses data from licensed institutions during trading hours and switches to prices from venues such as centralized-exchange derivatives after the close. Its research report says about 55% of tokenized stock trading happens outside regular hours (RedStone’s own figures).
— Excerpted from Listing Tokenized Stocks, Chapter 4: Price Sources and Off-Hours Rules
Full book: https://pickful.ai/books/kspm
轉發此貼文?
與您的關注者分享。
回覆